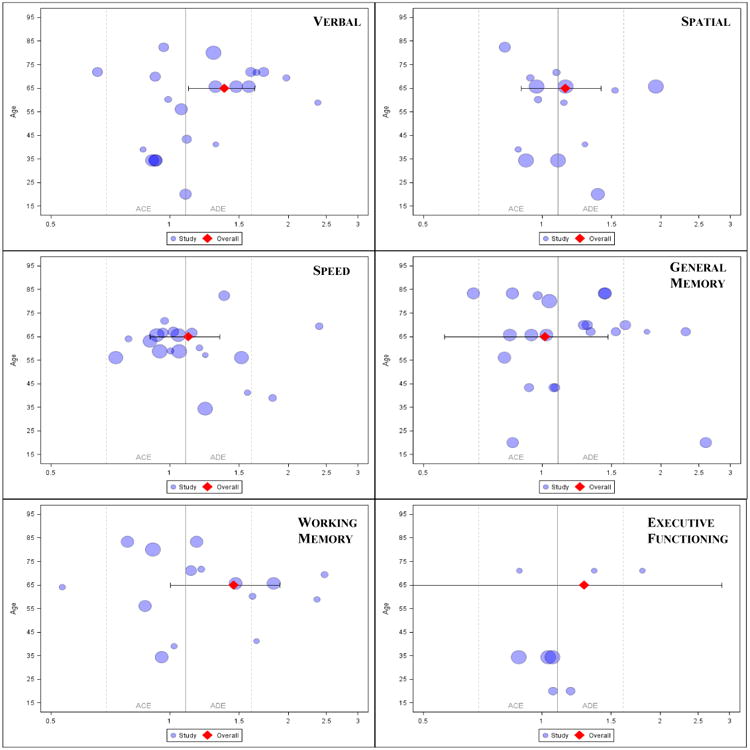
Figure 7.

MZ/DZ correlation ratios by study (log transformed) with overall estimate and 95% CI.
Note. Each ratio was transformed accordingly: ln(rMZ/rDZ +1). The blue circles represent study ratio values scaled relative to pair sample size. The red diamond represents the overall fixed effect estimate with a 95% CI. The solid gray vertical line at approximately 1.10 natural log units is equivalent to a raw ratio of 2.0. Dashed gray vertical lines indicate boundaries in natural log units equivalent to raw ratios of 1.0 and 4.0, respectively.
