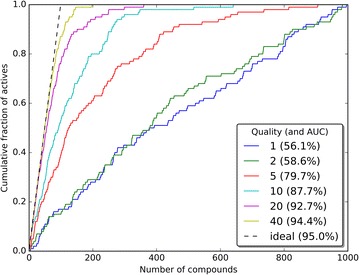
Fig. 3.

Visualization of the quality of the test models. In each case, 100 active compounds were distributed in a total set of 1000 compounds according to the distribution as defined by Eq. 17. The term ‘quality’ corresponds to the λ value of Eq. 17. The ‘ideal’ case was generated by positioning all 100 actives at the top-100 positions of the dataset. For each model, the AUC was calculated by integration using the composite trapezoidal rule
