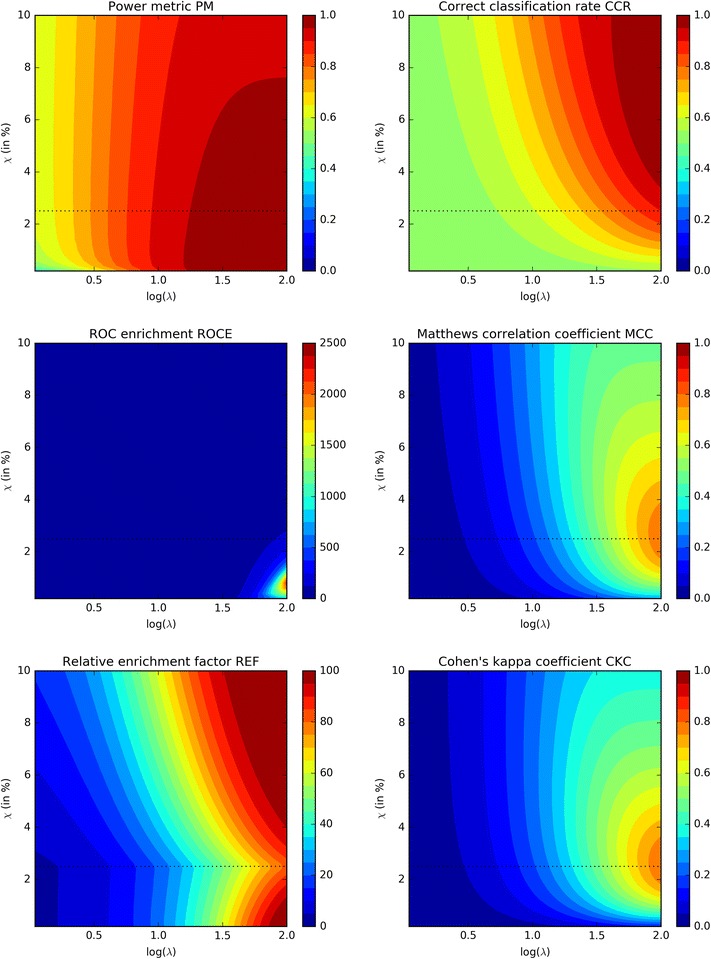
Fig. 4.

Comparison of the power metric with the five main other metrics (CCR, ROCE, MCC, REF and CKC) using a model dataset of 250 active compounds on a total number of 10,000. The logarithm of the quality parameter λ is varied along the abscissa [a log(λ) of 2 corresponds to a quality λ of 100] while the applied cutoff threshold χ is varied along the ordinates. The black dotted line at a cutoff value χ of 2.5% indicates the boundary of 250 compounds on a total of 10,000. In a perfect model, all 250 active compounds would be located along the topside of this boundary
