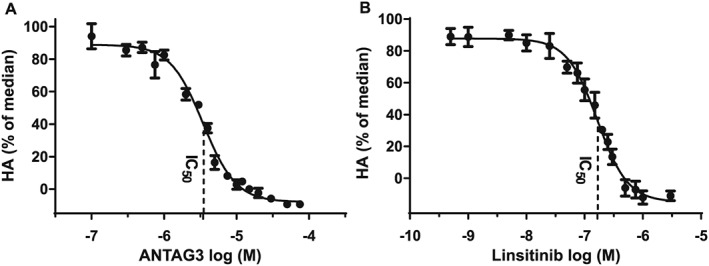
Figure 1.

Concentration‐response curves for ANTAG3 and linsitinib in GOF cells following stimulation by M22 ECmed. (A) Cultured GOF cells were stimulated with M22 ECmed and co‐treated with increasing doses of ANTAG3 for 5 days. Total HA was measured in culture media by elisa. Data represent mean ± SEM of seven different donor cell strains plotted as percent HA levels relative to the M22 median response (0% corresponding to HA levels at baseline). Indicated is the ANTAG3 IC50 concentration (3.34 μM). (B) Cultured GOF cells were stimulated with M22 ECmed and co‐treated with increasing doses of linsitinib for 5 days. Total HA was measured in culture media as described in A. The linsitinib IC50 concentration is indicated at 151 nM. Data represent mean ± SEM of seven different donor cell strains.
