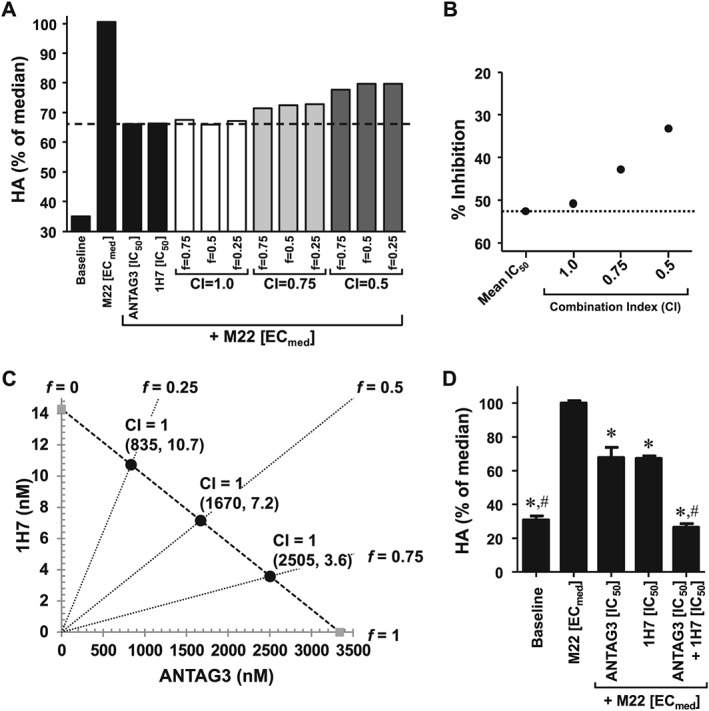
Figure 5.

ANTAG3 and 1H7 function additively in combination to inhibit HA production by M22 ECmed. (A) Cultured GOF cells were stimulated with M22 ECmed and co‐treated with ANTAG3 and 1H7 at different fixed‐ratios (f) for the defined CI values. All drug combinations were evaluated for their inhibitory effects on HA production by elisa analysis. Data represents mean from two donor cell strains plotted as percent HA levels relative to the M22 median response. The dashed line delineates the mean IC50 response of ANTAG3 and 1H7 in order to visualize dose equivalency for any of the indicated combination treatments. (B) The CI‐effect plot displays the averaged inhibitory effect grouped by CI value compared to the mean IC50 response of ANTAG3 and 1H7 (dotted line). Data represents mean from two donor cell strains. (C) The IC50 isobologram depicts the combinational effect of ANTAG3 and 1H7 on HA production. Cultured GOF cells were stimulated with M22 ECmed and co‐treated with ANTAG3 and 1H7 at the indicated fixed ratios (f) for 4 days. The Chou‐Talalay theorem was used to define dosing pairs based on different CI values at intersecting f ratios. All defined dosing pairs were evaluated for inhibitory effects on HA production by elisa. Only those dosing pairs with activity equivalent to ANTAG3 and 1H7 IC50 activity are plotted on the isobologram. (D) Cultured GOF cells were stimulated with M22 ECmed and co‐treated with ANTAG3 IC50 (3.34 μM), 1H7 IC50 (14.3 nM), or both in combination for 4 days. Total HA was measured in culture media by elisa. Data represents mean ± SEM from six different donor cell strains plotted as percent HA levels relative to the M22 median response. * P <0.001, significantly different from M22 [ECmed]. # P <0.001, significantly different from ANTAG3 [IC50].
