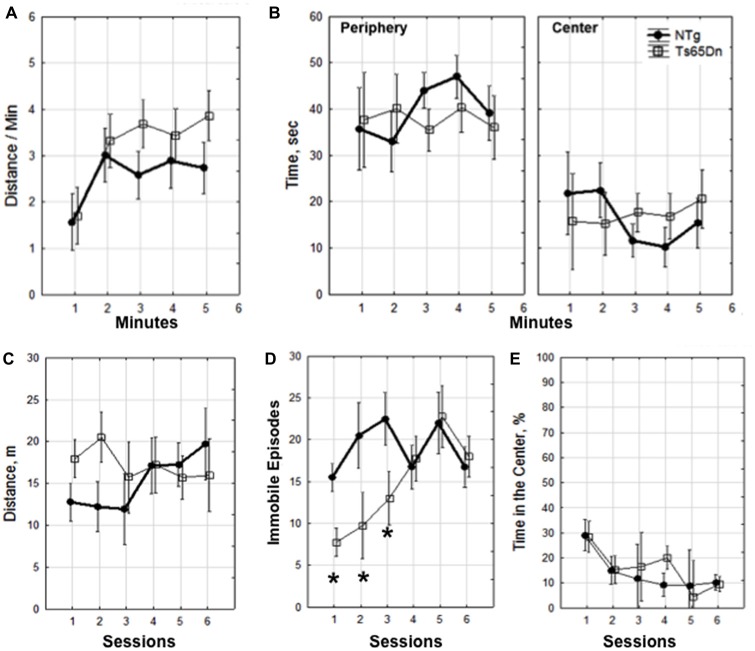
Figure 1.
Dynamics of exploration. Within session 1 (A,B). (A) Distance traveled per minute and (B) time in seconds spent in the periphery and center. Dynamics of exploration across sessions 1–6 (C–E). (C) Distance traveled in meters, (D) episodes of immobility, *p < 0.05. (E) percentage of time spent in the center of the environment. The data is presented as mean ± standard error of the mean (SEM). Four mice of each genotype were used for the behavioral analysis.

