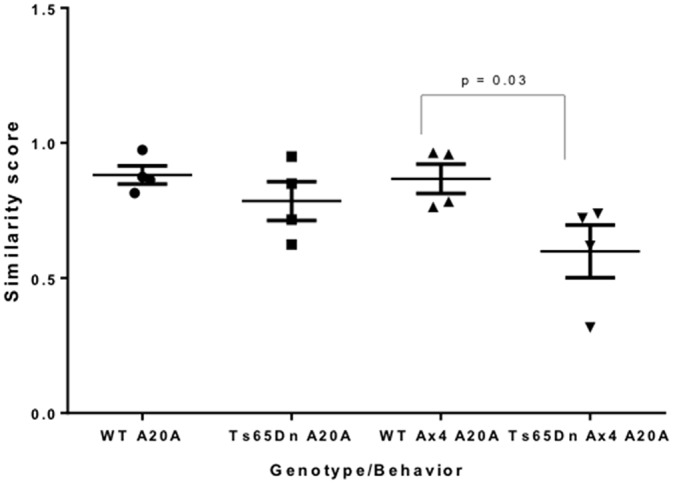
Figure 5.

Similarity scores of CA1 neurons in A20A and Ax4 A20A behavioral groups in Ts65Dn and WT mice. Data is represented by scatter plots of the mean ± SEM. A similarity score of 1 indicates complete overlap of neurons expressing Arc mRNA following the first and second exploration, while a similarity score of 0 indicates no overlap. The similarity score of 0.59 in CA1 of Ts65Dn Ax4 A20A mice is significantly smaller compared to WT Ax4 A20A mice (p = 0.03).
