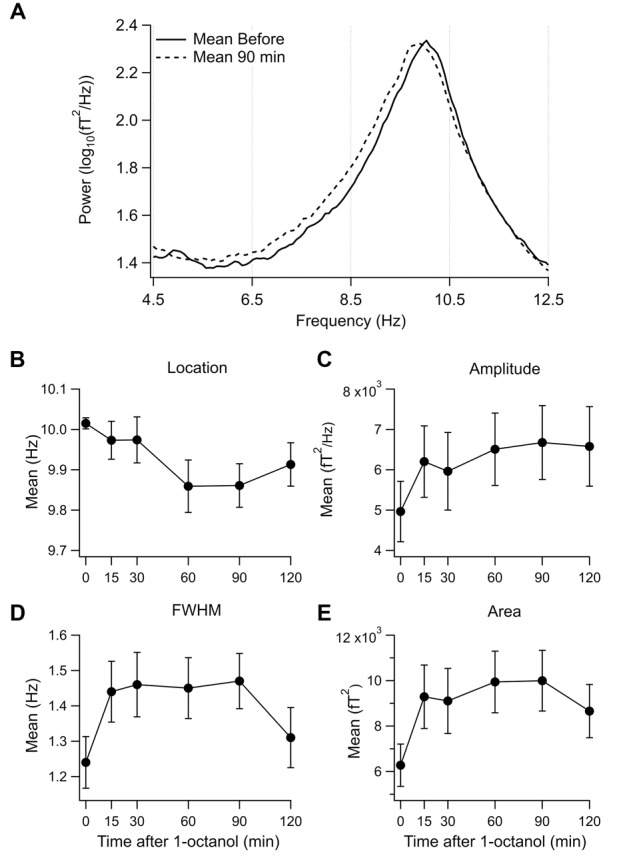
FIGURE 3.

Effect of 1-octanol on the alpha peak for set 1 subjects. (A) Superposition of mean power spectrum before (solid line) and 90 min (broken line) after 1-octanol for set 1 subjects. Note broadening of alpha peak to lower frequencies. (B–E) Plots of characteristics of the alpha peak as a function of time after 1-octanol. None reached significance but they show time course and trends following 1-octanol. FWHM, full width at half maximum.
