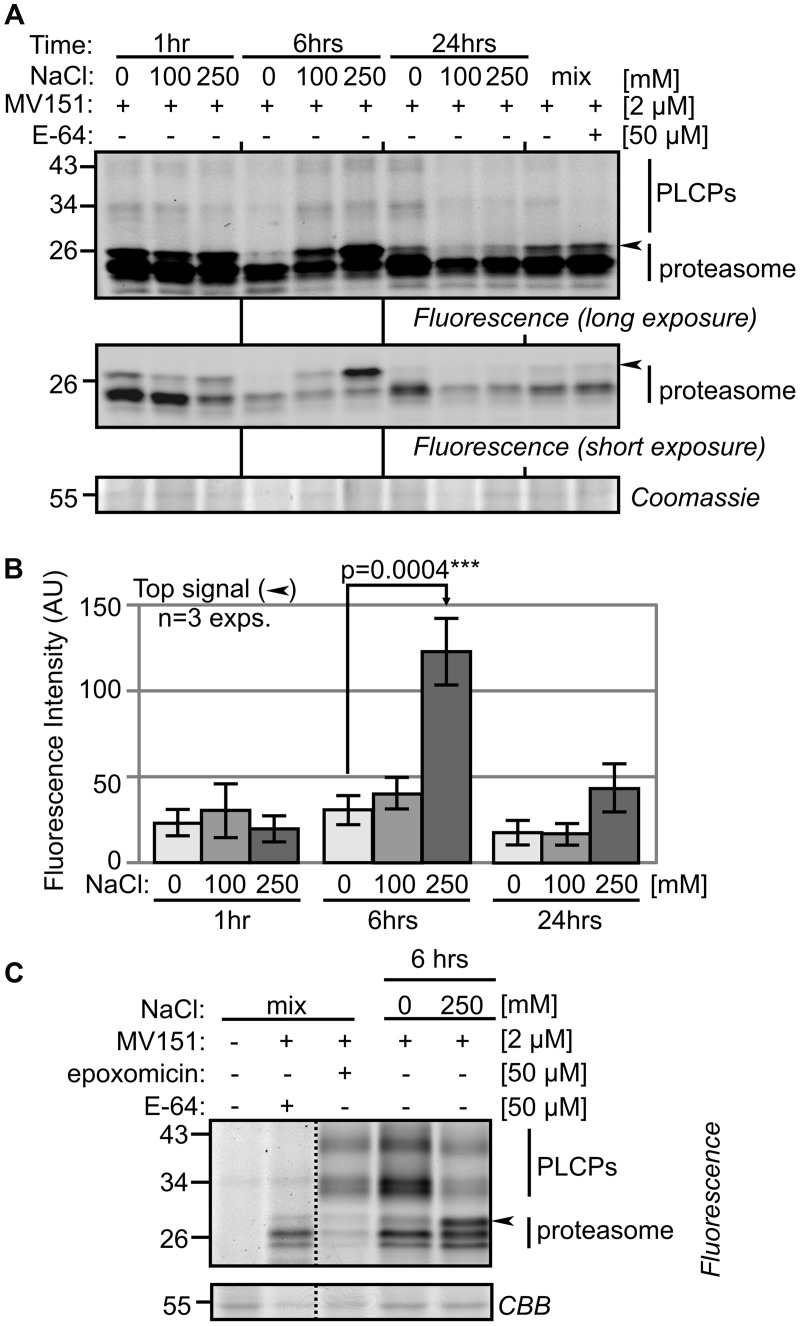
FIGURE 3.
MV151 activity profile changes upon salt stress in roots. (A) Differential activity profiles with MV151. Tomato roots were treated with 0-, 100-, 250 mM NaCl. Root extracts were generated after 1-, 6- and 24 h and labeled with 2 μM MV151 at pH 6.0. A mix of all nine samples was pre-incubated with or without 50 μM E-64 and labeled with 2 μM MV151. Shown is a representative gel at long and short fluorescence exposure and upon coomassie staining. The other two experimental replicates are shown as Supplementary Figure S2. (B) Quantification of the upper differential MV151 signal (arrowhead) taken from three experimental replicates (A) (Supplementary Figure S2). Error bars represent SEM of n = 3 experimental replicates. (C) Differential signal is suppressed by proteasome inhibitor. The 6 h 0- and 250 mM NaCl treated samples were labeled with 2 μM MV151. A mix of the two samples was pre-incubated with or without 50 μM E-64 or epoxomicin and labeled with or without 2 μM MV151.

