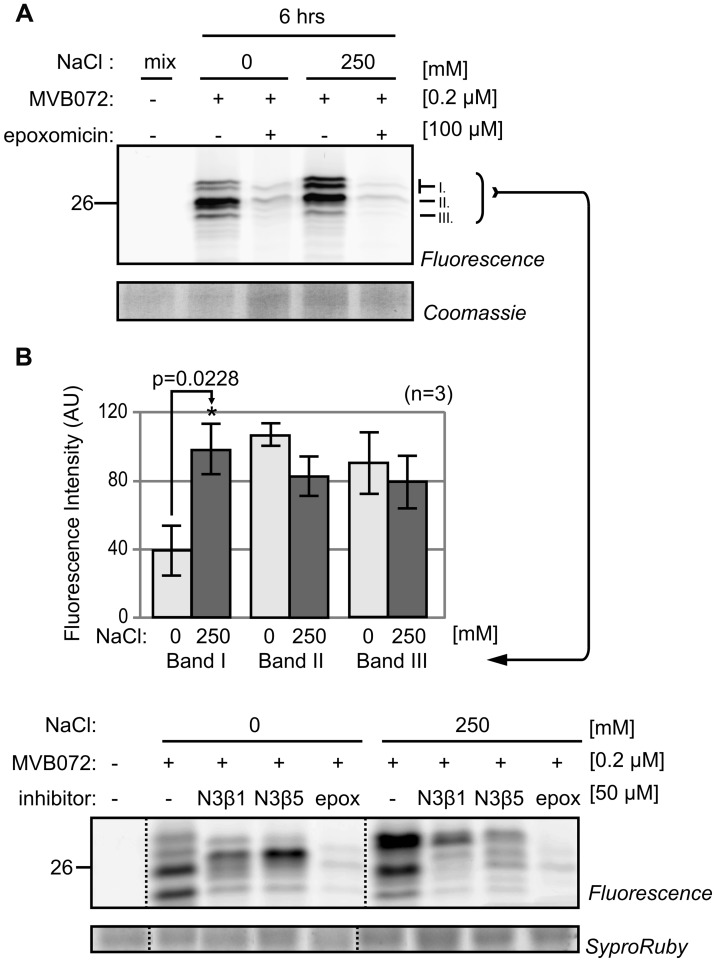
FIGURE 4.
Proteasome activity profile changes upon salt treatment. (A) Tomato roots were treated with 0- and 250 mM NaCl and root extracts were generated after 6 h and pre-incubated with or without 100 μM epoxomicin and labeled with or without 0.2 μM MVB072. (B) Quantification of bands I–III indicated in (A). Error bars represent SEM of n = 3 experimental replicates.

