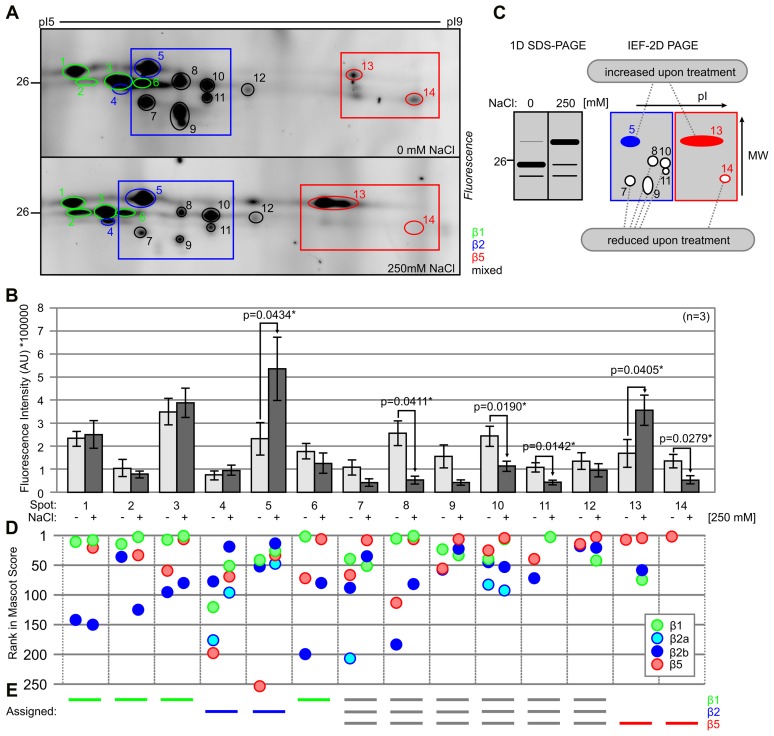
FIGURE 5.
Two-dimensional gels show molecular weight (MW) and pI shifts for labeled catalytic proteasome subunits. (A) Tomato roots were treated with 0- and 250 mM NaCl and root extracts were generated after 6 h and labeled with 0.2 μM MVB072. Samples were separated on IEF 2D gel. Spots are highlighted with different colors: β1 (green); β2 (blue); and β5 (red). Framed sections focus on β2 (blue) and β5 (red) catalytic subunits. (B) Quantification of the fluorescence signals of (A). Error bars represent SEM of n = 3 experimental replicates. (C) Schematic figures of 1D and 2D gel illustrating the effect of high salinity on the intensity of signals of β2 and β5 catalytic subunits. Closed and open spots indicate up- and down-regulated signals, respectively. (D) Ranking of detected catalytic subunits based on Mascot protein scores. (E) Assignment of catalytic subunits to some of the fluorescent spots, based on the detected proteins and their scores and ranking.

