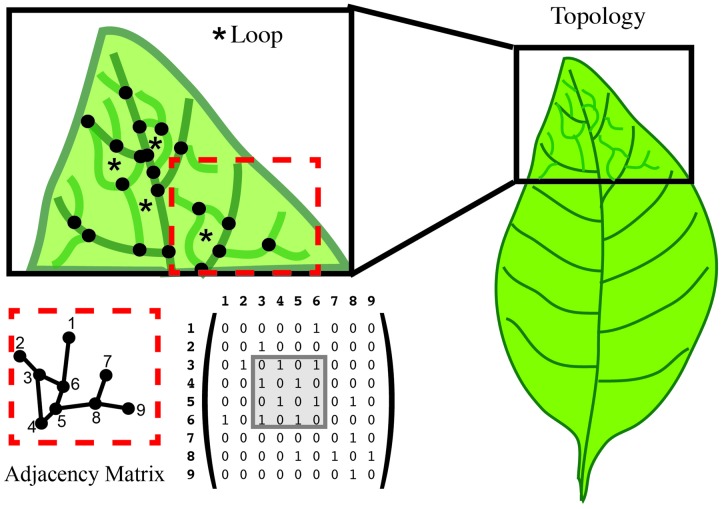
FIGURE 7.
Topology characterizes the relationship between features. In this leaf vein example, features are defined as the junction of branches (black dots). Topology can calculate the number of loops (asterisk in the upper left), and the number of junctions forming that loop. An adjacency matrix that defines the connection between two features can be used to represent these data. The connection between features is represented in a numerical matrix. Connected features are represented by a “1” in the adjacency matrix. Loops can be visualized within the matrix (gray box).

