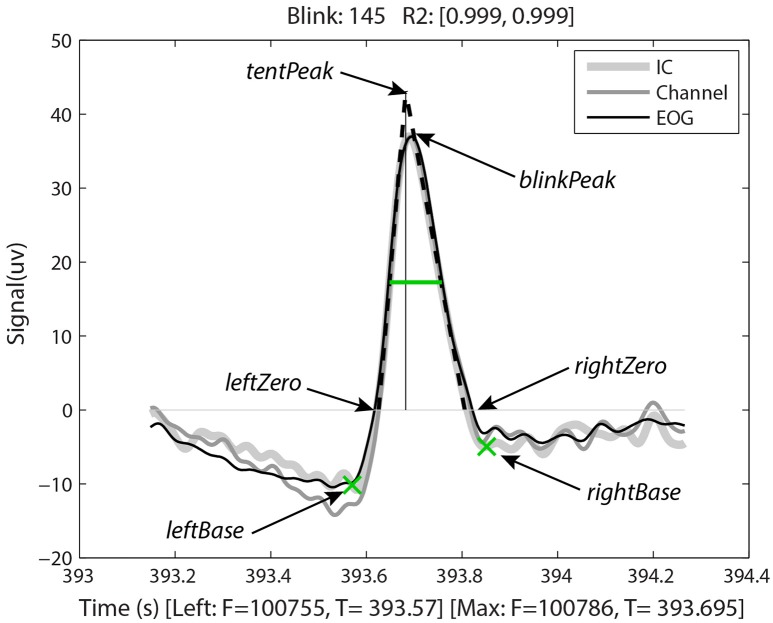
Figure 2.
Output of BLINKER software showing various blink landmarks. The figure overlays three different time-series (an independent component, an EEG channel, and an upper vertical EOG channel, respectively) corresponding to the time of the blink. The green crosses mark the leftBase and rightBase, respectively. The green horizontal line marks the half-zero duration. The dotted black lines represent the best linear fits to the upStroke and downStroke of the blink, respectively. The thin vertical line is the perpendicular from the tentPeak to the zero line.

