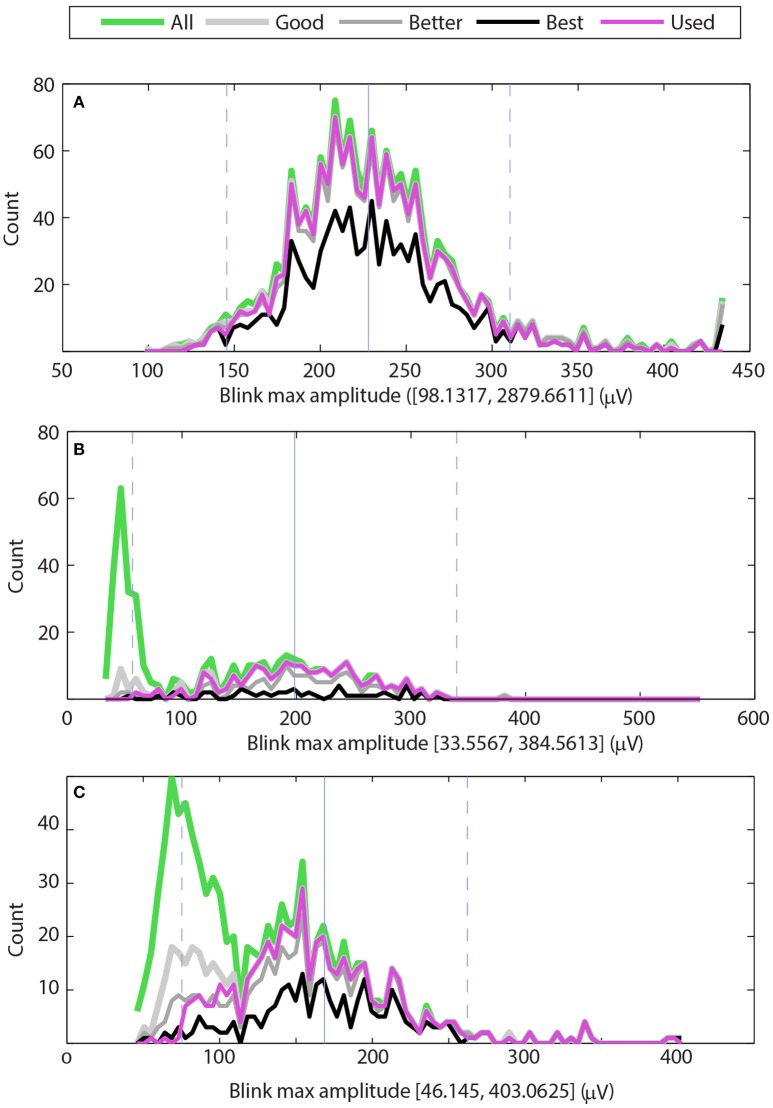
Figure 3.
Distributions of maximum blink amplitudes for the upper vertical EOG channel of three different datasets. The green line shows the histogram for all potential blinks, and the thick light gray line shows the histogram for blinks whose R2 values are at least 0.90 (good). The medium gray line shows the histogram for blinks whose R2 values are at least 0.95 (better), and the black line shows the histogram of blinks with R2 values of at least 0.98 (best). The magenta line shows the histogram of blinks selected by BLINKER. (A) Dataset has a typical distribution of blinks with a few very large amplitude non-blink artifacts. (B) Dataset has a significant number of low-amplitude non-blink eye movements well-separated from normal blink amplitudes. (C) Dataset has a significant number of non-blink eye movements with moderate R2 values and amplitude distribution that overlaps with the normal blink amplitude distribution.

