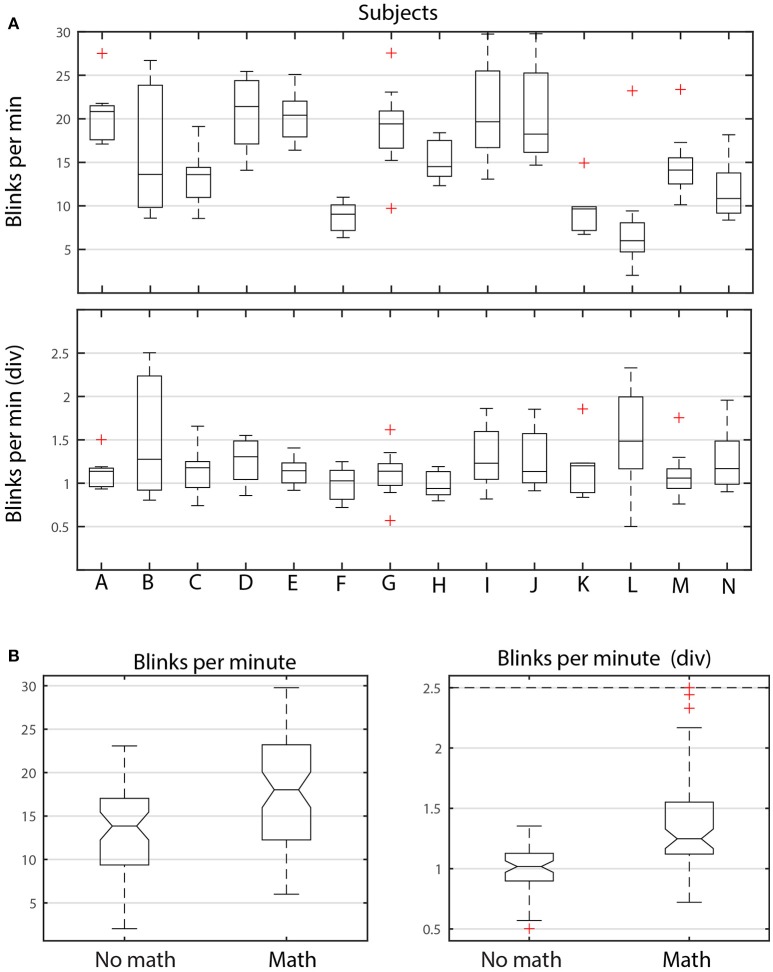
Figure 6.
ANOVA analysis of blink rate for ARL-Shoot. (A) Top panel shows the distribution of average dataset blink rate for each of the 14 subjects (A through N) over the 9 tasks. The bottom panel shows the same distributions when each average is divided by the average of the dataset blink rates for no-math tasks. (B) Left panel compares the distributions of dataset average blink rates, grouping the math and no-math tasks for all subjects. The right panel shows the same distributions after dividing the dataset average blink rates by the subject's average no-math blink rate.

