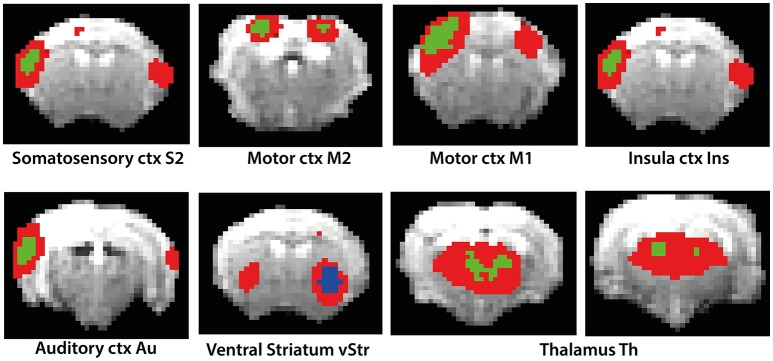
Figure 2.
Results of Dual Regression analysis for eight components derived from ICA (red color overlay). The reference of the components to anatomical structures is indicated in the figure. Bonferroni corrected DR results showing the regions whose co-activation with the ICA components (as shown in the figure) was significantly higher (green color) or lower (blue color) in isoflurane as compared to medetomidine-anesthetized mice.

