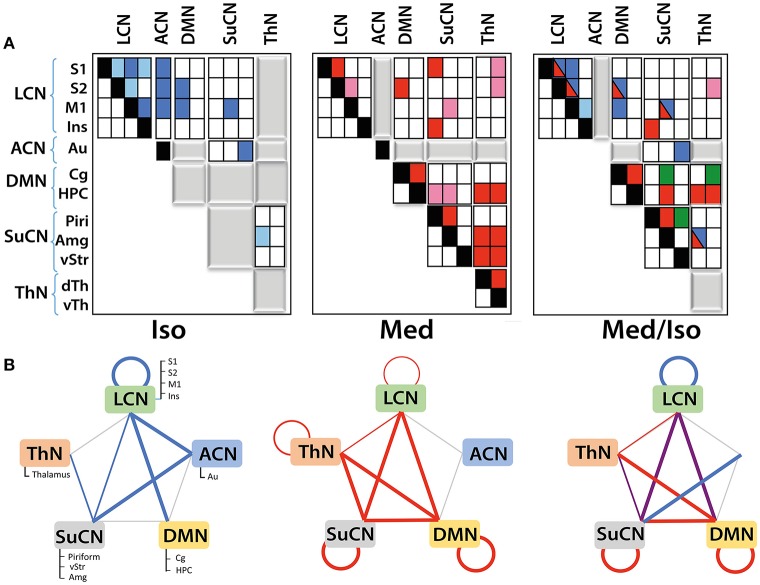
Figure 4.
Functional networks and their interaction as derived from DR analysis: (A) Matrices displaying within- and between-network interactions under the various anesthesia regimens. Matrices have been structured according to the five functional networks identified. Colors indicate significant interactions observed under isoflurane (blue) or medetomidine anesthesia (red). For the group receiving the combination anesthesia, elements are indicated in different colors depending on whether they apparently arise from the isoflurane group (blue), from the medetomidine group (red), from both groups (blue/red) or were observed in the combination group exclusively (green). Positive correlations are indicated by dark colors, while light colors represent negative correlations. Gray blocks indicate the absence of any significant interaction. Significant group differences (with Bonferroni correction) in connectivity have been observed for all the interactions displayed. (B) Within- and between-network interactions detected in isoflurane (blue lines), medetomidine (red lines) and medetomidine/ isoflurane anesthetized mice. In isoflurane/medetomidine anesthetized mice network interactions, blue lines represent interactions observed in mice under isoflurane anesthesia only, red under medetomidine only, and violet represents interactions observed for both anesthesia regimes. The width of the lines in the figure indicates the strength of the connectivity.

