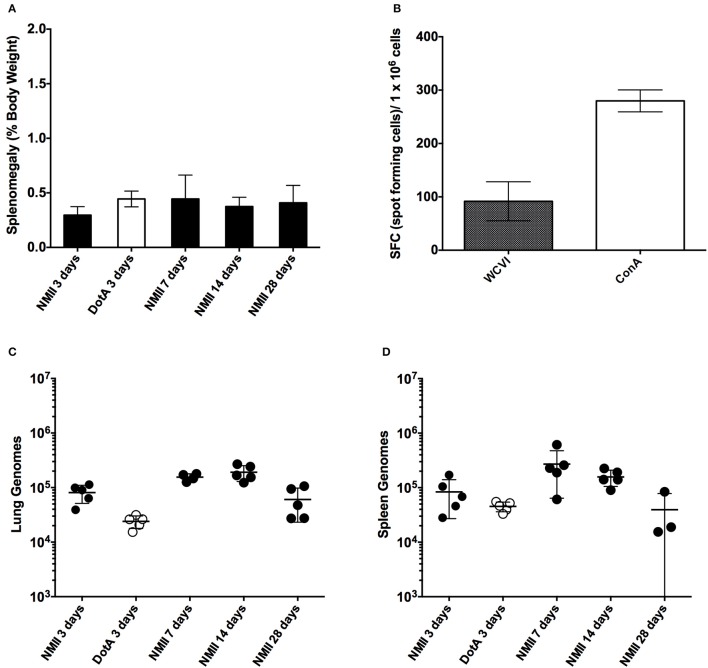
Figure 1.
Time course of intra-peritoneal challenge of C57/BL6 mice with NMII and the specific IFN-γ CD4+ T-cells response. (A) Splenomegaly calculated as spleen weight as a percentage of total body weight at the time of necropsy on days 3, 7, 14, and 28 after infection with 1 x 10⁶ GE of NMII, or at 3 days after infection with 1 x 10⁶ with dotA NMII mutant. (B) IFN-γ ELIspot was performed using CD4+ T cells purified from NMII infected spleens at 28 days after infection and stimulated with naïve splenocytes loaded with formalin-fixed NMI (WCVI), or stimulated with concavalin A (ConA). Data are represented as spot forming cells per 1 × 10⁶ cells after deduction of the background spots counted in un-stimulated control wells. (C) Genome equivalents calculated using TaqMan real-time PCR with DNA purified from infected lungs from 5 mice on days 3, 7, 14, and 28 days after infection with 1 × 10⁶ GE of NMII or at 3 days after infection for 1 × 10⁶ with dotA NMII mutant. (D) Genome equivalents calculated using TaqMan real-time PCR with DNA purified from infected spleens from 5 mice on days 3, 7, 14, and 28 days after infection with 1 × 10⁶ GE of NMII or at 3 days after infection for 1 × 10⁶ with dotA NMII mutant. For all panels, error bars represent standard deviations from the mean.

