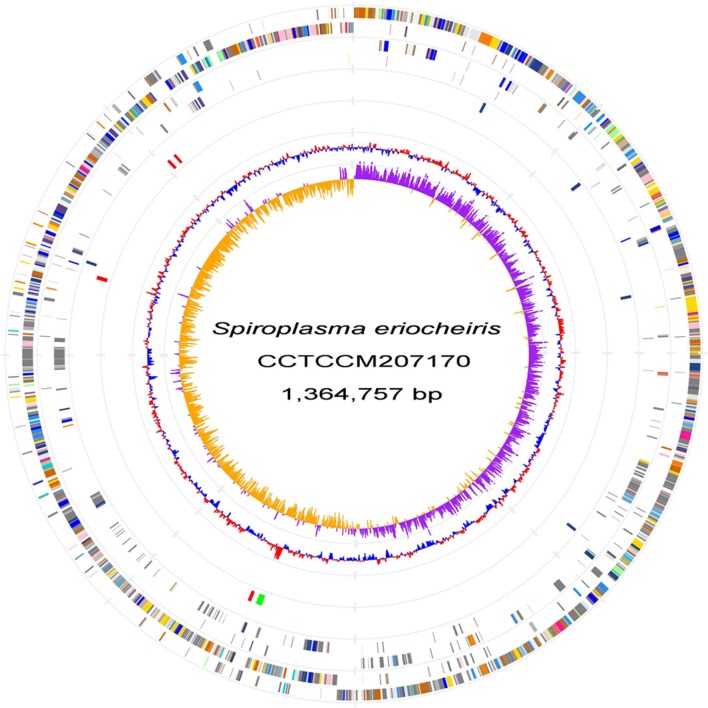
Figure 1.
S. eriocheiris genome. Chromosome atlas of S. eriocheiris. Each concentric circle represents different genomic features. The outermost circle shows predicted protein-coding sequences on both strands, colored for functional categories according to the COG classification. The second circle shows genes specific for the S. eriocheiris genome. The third circle shows tRNA genes on plus (blue) and minus (red) strands, and ribosomal RNA genes (green). The forth circle shows IS elements. The fifth circle shows the mean centered G + C content using a 1 kb window colored red and blue for values above and below, respectively. The innermost circle shows GC skew (G−C)/(G+C) calculated using a 1 kb window colored purple and yellow for values plus and minus, respectively.

