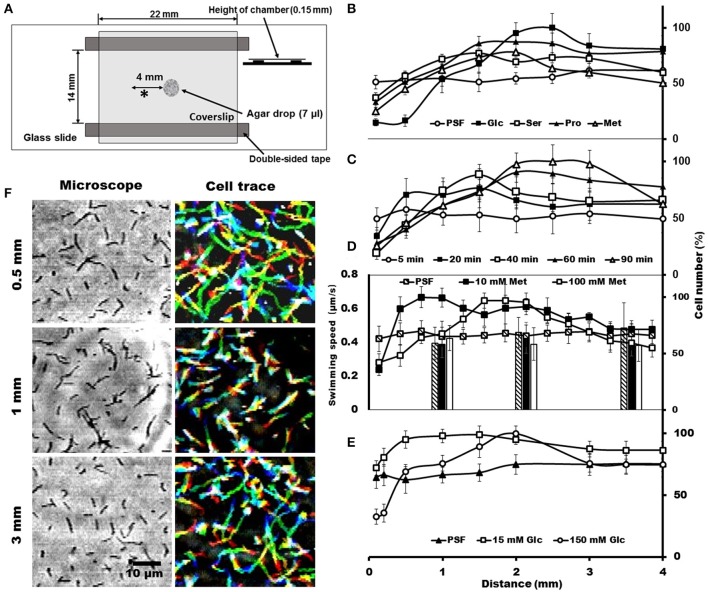
Figure 3.
Cell distributions and behaviors in the agar-drop assay. (A) Schematic representation of the chamber. A drop of 1% agar (7 μl) was placed at the center of a glass slide, and a coverslip was attached to the glass slide using two pieces of double-sided tape. Various chemicals were added to the agar drop as necessary. The observing area is marked by an asterisk (*). (B) Cell numbers at different positions from the agar drop containing either 200 mM glucose, 150 mM serine, 150 mM proline, or 100 mM methionine. An agar drop without an attractant was used as a control. The number of cells is shown by the ratio relative to the highest point. The maximum cell numbers ranged from 425 to 770 through panels (B–E). (C) Cell numbers counted at different positions from the agar drop containing 100 mM methionine after the following different incubation times: 5, 20, 40, 60, and 90 min. (D) Cell numbers at different positions from the agar drop counted in the presence of 0, 10, and 100 mM methionine. The bars indicate the swimming speeds of cells at different positions from the agar drop. (E) Cell numbers at different positions from the agar drop were counted in the presence of 0, 15, and 150 mM glucose. (F) Phase-contrast (left) and cell-trace (right) images exhibiting the cell behaviors at different positions 0.5, 1, and 3 mm from the agar drop containing 100 mM methionine. Cell trajectories for 8 s are presented as a stack, changing their color from red to blue.

