Figure 4.
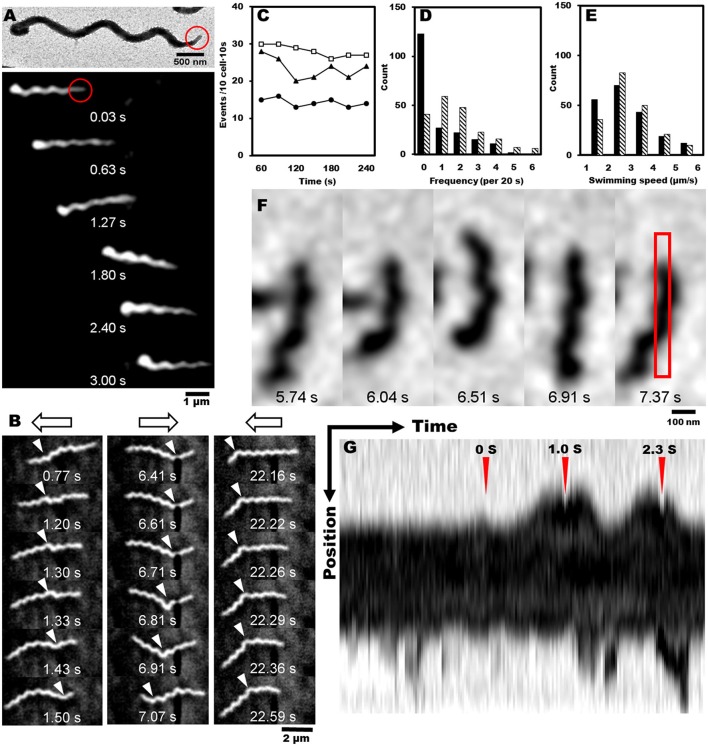
Reversal behaviors of swimming and tethered cells. (A) Upper: negatively stained EM image of spiroplasma cell, the tip structure of which is marked by a red circle. Lower: montage image showing that spiroplasma swim in the direction of the tip structure. (B) Consecutive cell images from a video showing reversal behavior of swimming. Open arrows on the top indicate swimming directions, and white triangles indicate kink positions. (C) Reversal frequencies of ten cells in 10 s in the presence of various concentrations of methionine, 0 (solid circle), 3 (solid triangle), and 30 mM (open square). (D) Reversal frequencies of swimming cells from aerobic (solid) and anaerobic (hatch) cultivations. (E) Swimming speed of cells from aerobic (solid) and anaerobic (hatch) cultivations. (F) Consecutive images of a cell attached to the glass slide. The area for kymograph is boxed in the rightmost image. (G) Kymograph of cell image after the cell was exposed to 20 μM of methionine at time 0 marked by red triangle. Reversal behaviors were observed around the peak times at 1.0 and 2.3 s marked by red triangles.

