Figure 6.
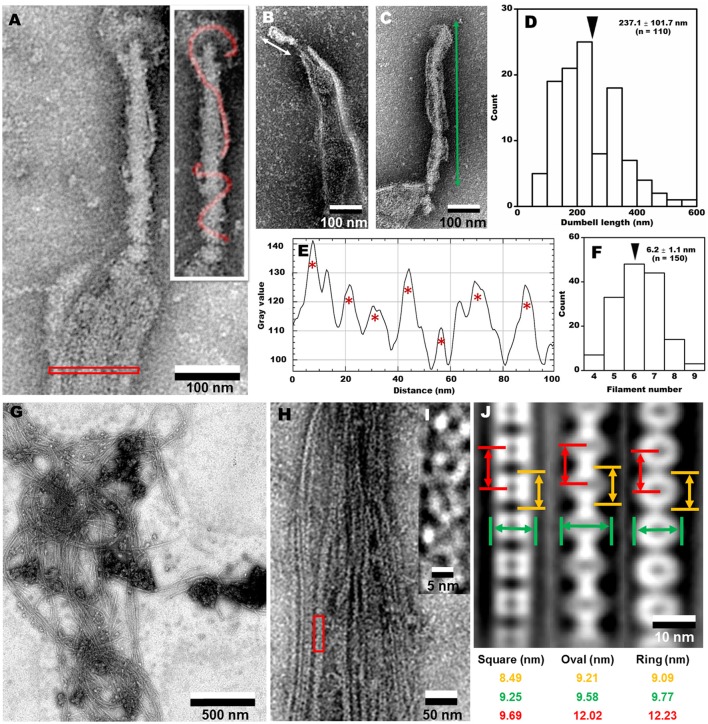
Analyses of internal structures by negative-staining EM. (A) A high resolution image of tip structure shown in Figure 5K. The helical structure around the dumbbell is colored in the inset and the area for ribbon profile is boxed. (B,C) Short (B) and long (C) dumbbells exposed by Triton X-100. (D) The length distribution of dumbbell structure. The average is marked by a black triangle. (E) The density profile of ribbon in the cell indicated by a red box in (A). Seven filaments were detected as peaks marked by red asterisks. The peaks were detected only when the peak was higher than 100 units compared to the adjacent lower inflection points. The filament numbers in a cell are presented in (F). The average number is marked by a black triangle. (G) Field image of isolated filaments after the treatment with 0.8% Triton X-100. (H) Magnified images of isolated filaments. (I) The red box area in (H) was magnified. (J) Three types of averaged filaments, with type names and dimensions in the bottom.

