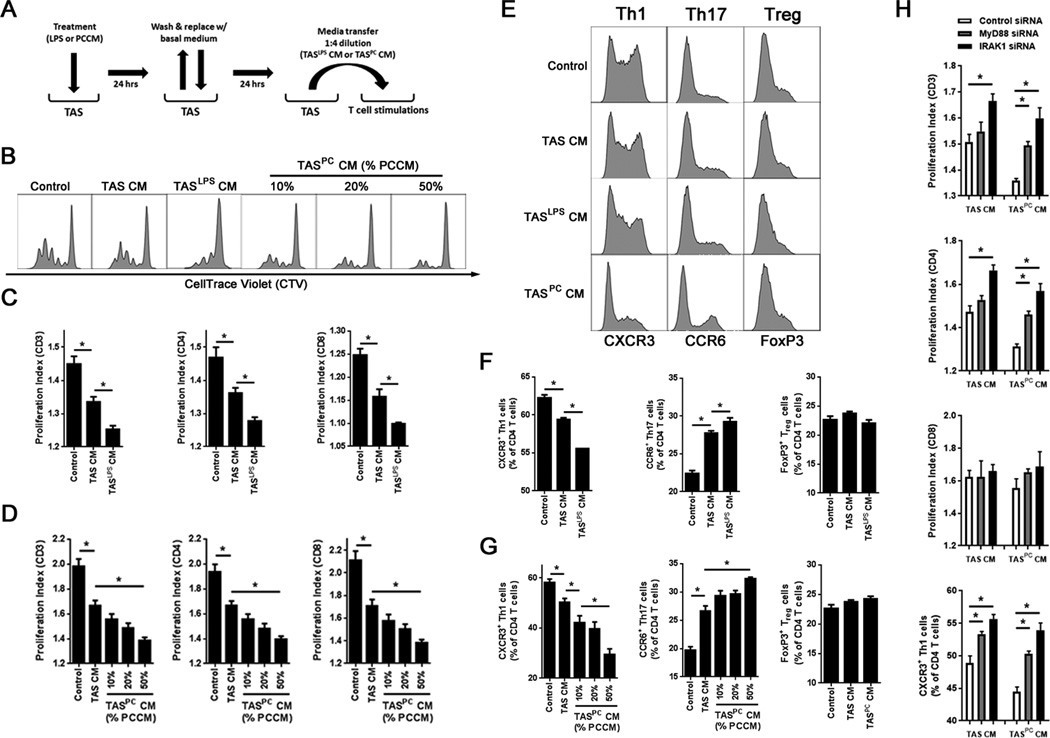
Figure 5. The TAS innate immune response to pancreatic cancer conditioned media or TLR4 stimulation suppresses and polarizes adaptive immunity in a MyD88-dependent manner.
A, TAS cultures were treated for 24 hours with either 100 ng/ml of ultrapure LPS or PCCM (50%). Cells were then washed and returned to fresh growth medium for an additional 24 hours. Conditioned media from TAS was then transferred to magnetically sorted, CellTrace™ Violet (CTV)-stained T cells from a healthy volunteer at a 1:4 dilution (20%) in growth medium. T cells were stimulated with anti-CD3/CD28/CD137 beads for four days in the presence of IL2 (50 U/mL). B, representative histograms evaluating T cell proliferation via CTV dilution for control T cells, TAS conditioned media (TAS CM)-treated T cells, LPS pretreated TAS CM-treated T cells (TASLPS CM), or PCCM pretreated (10%, 20% or 50% PCCM) TAS CM-treated T cells (TASPC CM). C and D, proliferation indices for total T cells (CD3), CD4, and CD8 T cells were calculated for (C) TASLPS CM and (D) TASPC CM. (E) Representative histograms for CD4 T cells expressing CXCR3 (Th1), CCR6 (Th17) or FoxP3 (Treg). F and G, percentage of CD4 T cells with a Th1, Th17 and Treg phenotype were quantified after stimulation in the presence of (F) TASLPS CM and (G) TASPC CM groups. H, T cell stimulations were performed using conditioned media generated from TAS after siRNA knockdown of MyD88, IRAK1 or control siRNA. Proliferation indices of CD3, CD4 and CD8 T cells are displayed as well as Th1 polarization. Bars represent mean ± S.E.M. *P < 0.05 using the independent samples t test.

