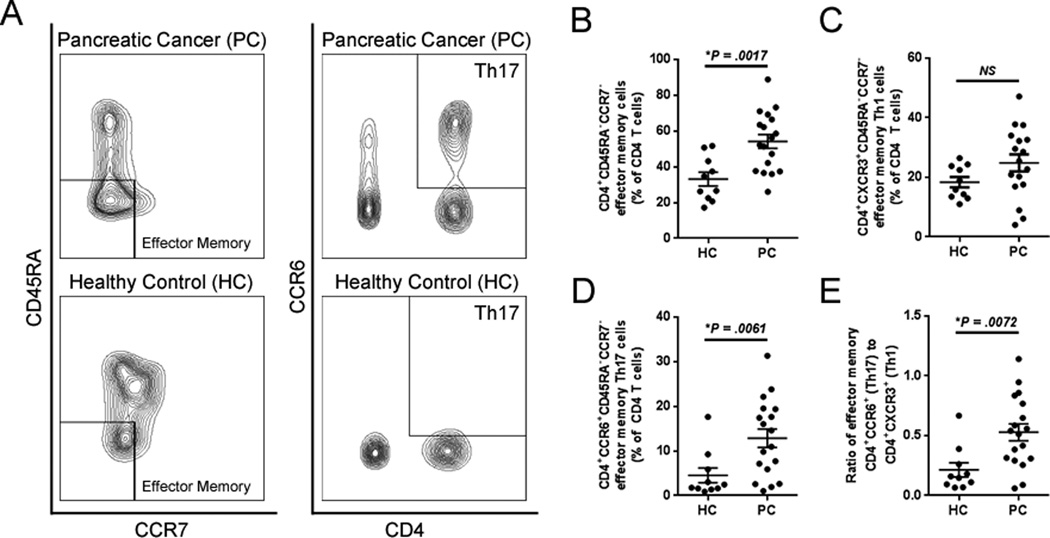
Figure 6. Th17 polarization of systemic effector memory T cells in patients with PC.
A, representative contour plots of peripheral blood T cells (gated on live CD3+ cells) evaluated for CD45RA−CCR7− effector memory phenotypes as well as CD45RA−CCR7−CD4+CCR6+ effector memory Th17 cells. B, circulating CD45RA−CCR7− effector memory T cells were quantified in patients with pancreatic cancer (PC, n=18) vs. healthy controls (HC, n=10). C and D, the frequency of effector memory T cells polarized toward (C) Th1 or (D) Th17 as well as (E) the ratio of Th17/Th1 effector memory cells were quantified. Bars represent mean ± S.E.M. *P < 0.05 using the Mann Whitney U test.

