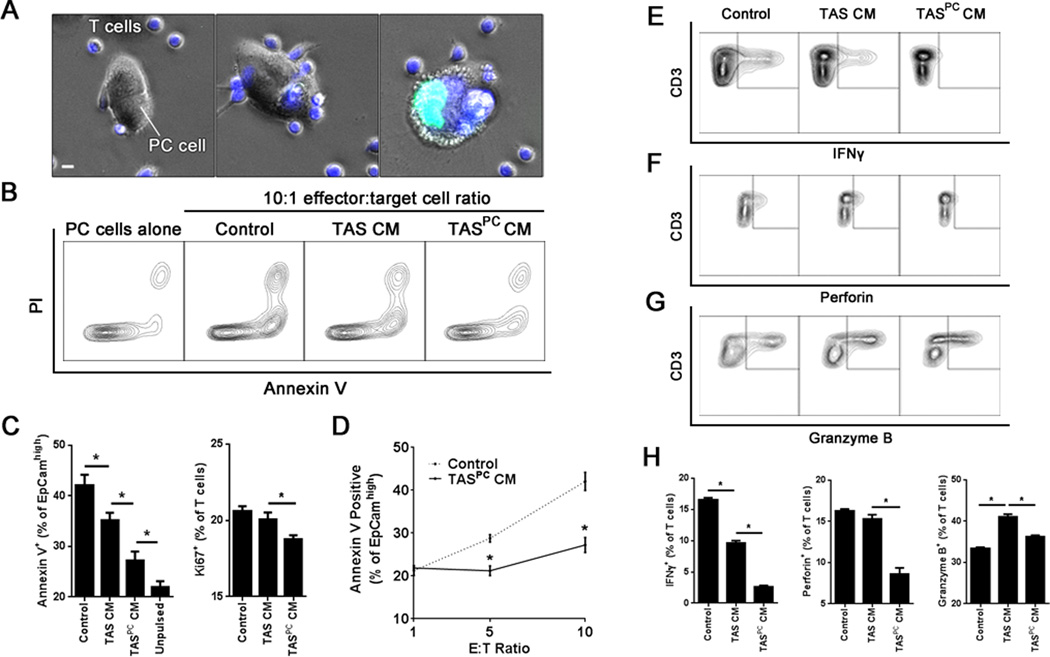
Figure 7. The stromal innate immune response to pancreatic cancer suppresses antitumor T cell-mediated lymphotoxicity.
A, transgenic HLA-A2, MART1-specific CD8 T cells were labeled with CellTracker Blue (blue) and co-cultured with MART1-pulsed primary PC cells in the presence of SYTOX® Green (green). Representative images of co-cultures are displayed. Scale bar indicates 5 µm. B, representative contour plots evaluating apoptosis at 24 hours in EpCamhigh PC cells using annexin V and propidium iodide (PI) stains. C, quantification of annexin-positive apoptotic cancer cells (left) and Ki67-positive proliferating CD8+ T cells (right) under each indicated condition at a 10:1 effector:target (E:T) cell ratio. Unpulsed cells indicate the absence of exogenous MART1 peptide and thus served as a negative control. D, PC cell apoptosis was evaluated at the indicated E:T cell ratios for both control and PCCM-stimulated TAS CM (TASPC CM) conditions. Representative contour plots of (E) IFNγ, (F) perforin and (G) granzyme B expression in T cells as well as (H) quantification of each population for the indicated conditions at a 10:1 E:T ratio. Bars represent mean ± S.E.M. *P < 0.05 using the independent samples t test.

