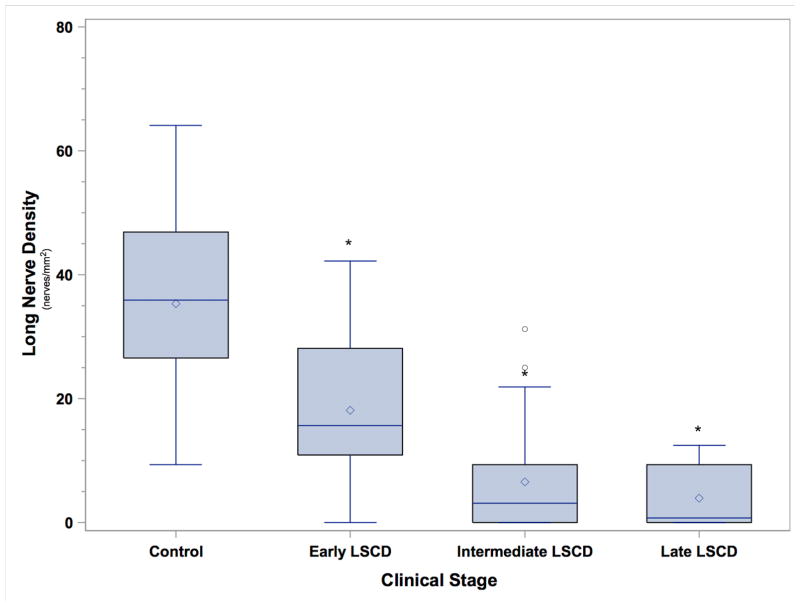
Figure 3.
Box and whisker plot of long nerve density (nerves/mm2) in the control group (C) and in patients with LSCD in the early stage (E), intermediate stage (I), or and late stage (L). The long nerve density in all patients with LSCD was significantly less than that in the controls. Asterisk denotes P < 0.0001.

