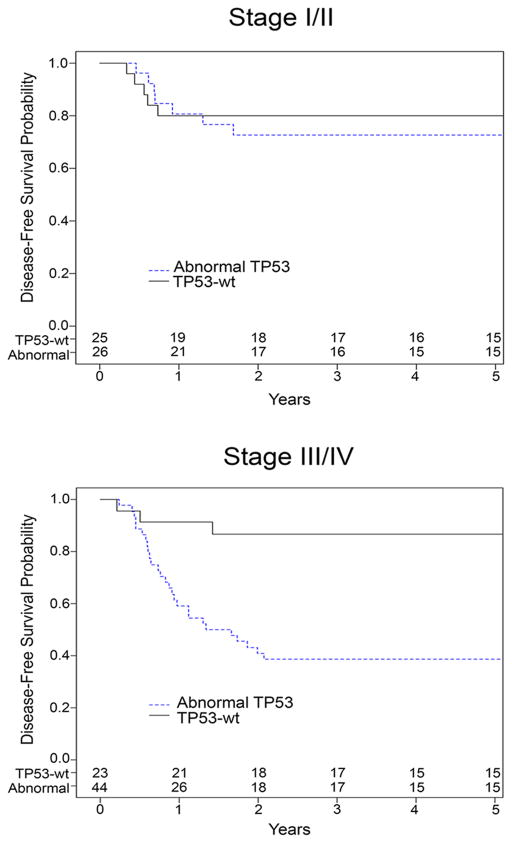
Figure 2. Association between stage, TP53 status and Disease Free Survival.
Kaplan-Meier curve of Disease Free Survival (DFS) (in years), comparing DAWTs with TP53 mutation and/or copy loss and DAWTs without either. Numbers at risk are listed at the bottom of the graphs. All patients who relapsed or progressed also died.

