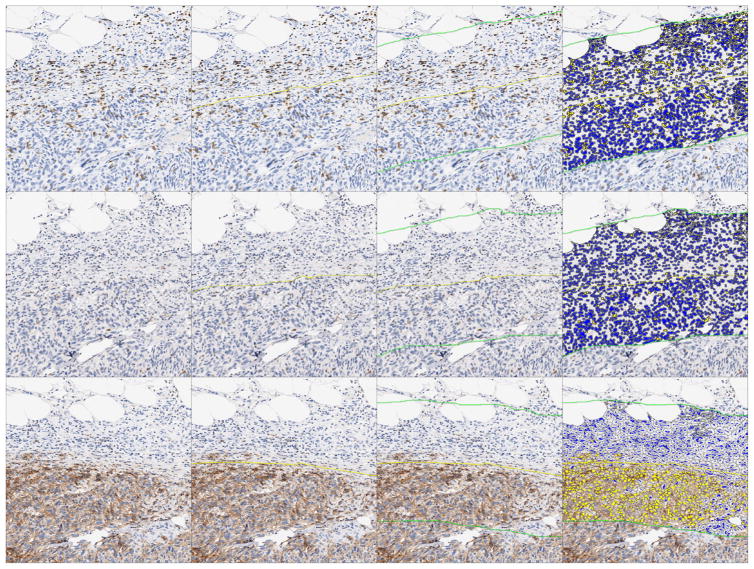
Figure 2.
Overview of quantitative immunohistochemistry image analysis. Images represent the same fields of view of serial sections from tumor tissue. Tumor area (yellow line) is delineated via cell morphology and the presence of synovial sarcoma tumor markers in corresponding serial sections (Bcl-2, CD99, EMA, or NY-ESO-1). Once the tumor border has been established, a perimeter of 400 micron thickness is established via concentric partitioning, consisting of 50% intra-tumor space and 50% extra-tumor space. This perimeter (the area between the two green lines) is defined as the tumor invasive margin. CD8, PD-1, and PD-L1 cell density analyses are then performed in serial sections for both the intra-tumor and the invasive margin niches, with cell density reported as number of positive cells/mm2. Cells marked yellow are scored as positive, while cells marked blue are scored as negative. Magnification 80X.

