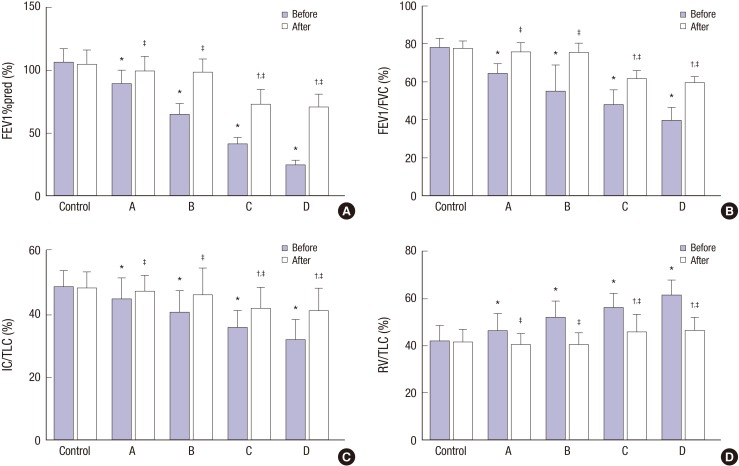
Fig. 2.
Comparisons of pulmonary function in ACOS patients with different disease severity and control group before and after treatment.
ACOS = asthma-chronic obstructive pulmonary disease overlap syndrome, A = mild ACOS group, B = moderate ACOS group, C = severe ACOS group, D = extremely severe ACOS group, FEV1%pred = percentage of forced expiratory volume in 1 second (FEV1) to predicted value, FEV1/FVC = the ratio of FEV1 to forced vital capacity, IC/TLC = ratio of inspiratory capacity to total lung capacity, RV/TLC = ratio of residual volume to total lung capacity, Before = before the 6-month treatment, After = after the 6-month treatment.
*P < 0.05, compared with the control group before treatment; †P < 0.05, compared with the control group after treatment; ‡P < 0.05 when compared with the mild ACOS, moderate ACOS, severe ACOS, extremely severe ACOS, and control groups before treatment.

