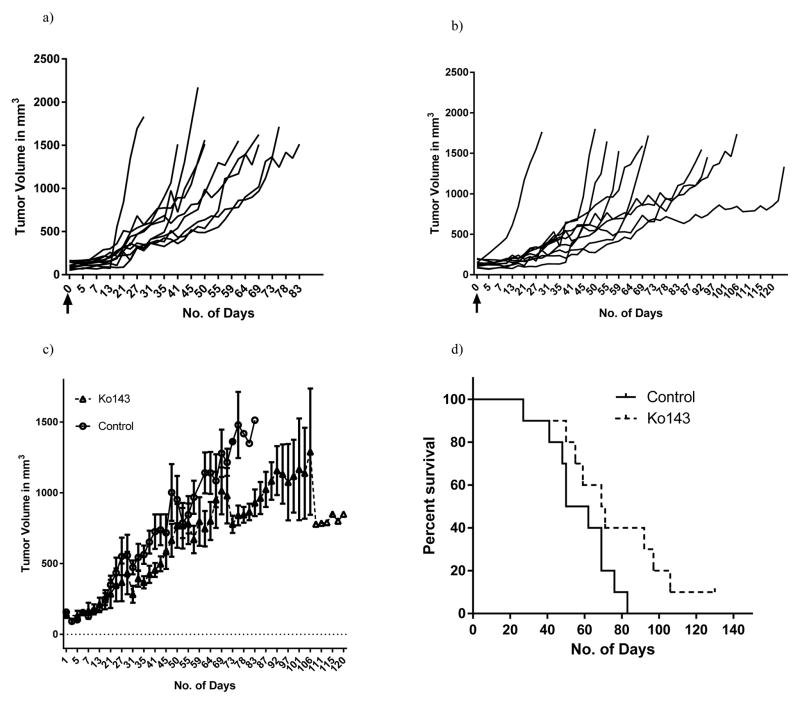
Figure 4. Inhibiting the ABCG2 transporters by Ko143 slows tumor progression and increases the overall survival in vivo.
Tumor trajectories of individual mice in the (a) control (n=10) and (b) Ko143 treated group (n=10) respectively. The black arrows represent day 0, when the treatments were started. Figure (c) depicts the average tumor growth rate of mice in the control and Ko143 treated group. Statistical analysis was done using the Linear mixed modelling. Figure (d) represents the overall survival of mice in both the groups as computed by the time taken for the tumors to reach a volume of 1500mm3. Difference in the slopes of placebo and Ko143 treated animals was computed using the Log-rank Test.

