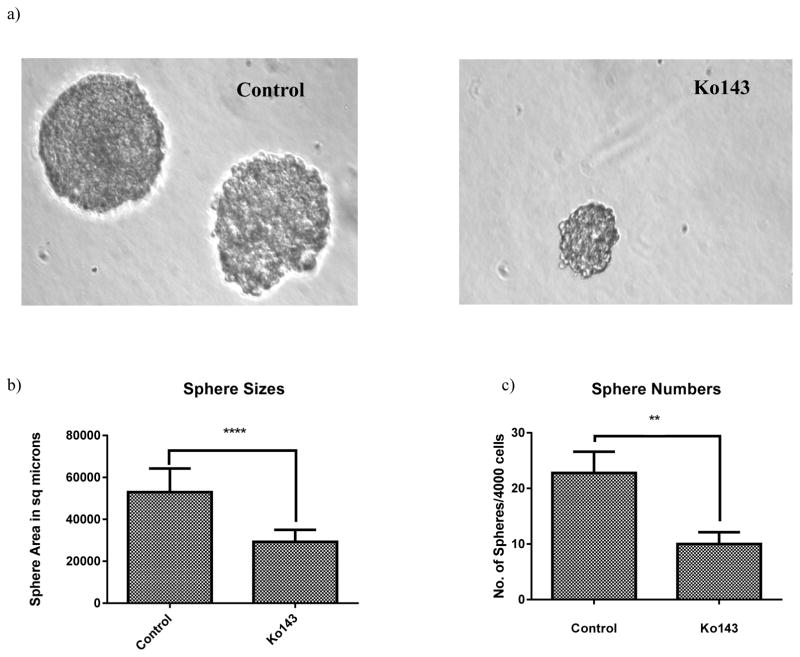
Figure 5. Cells isolated from tumors of mice in the treated group showed impaired sphere formation.
Cells were isolated from tumors of mice in the control (n=3) and Ko143 group (n=3) by protease digestion and plated in 24 well ultralow attachment plates coated with matrigel at a density of 4000 cells/well. On day 14, spheres were (a) imaged under 20X magnification, (b) sphere sizes were measured by the basic SPOT software and (c) spheres were counted. The student’s t test was used for statistical analysis (p**<0.01; ****p<0.0001).

