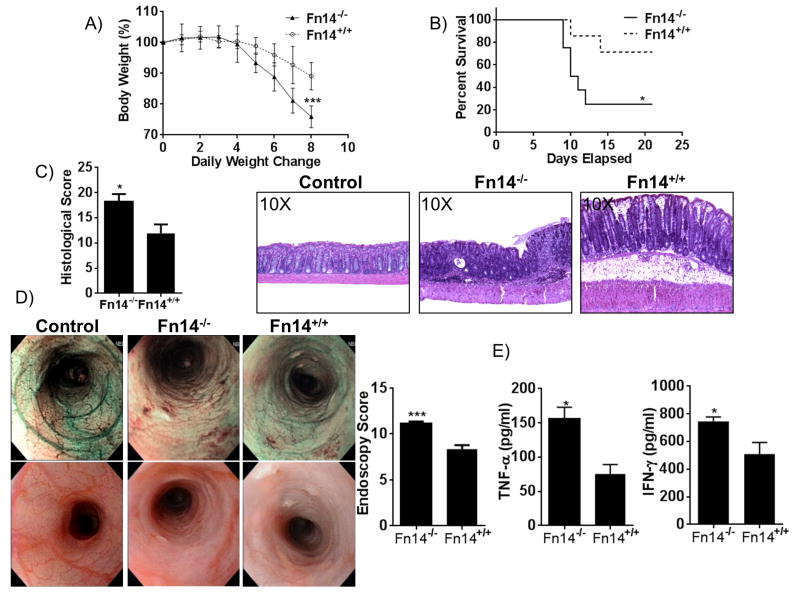
Figure 1. Fn14 alleviates DSS-induced colitis in mice.
(A) Time-course of changes in body weights expressed as percentages of pre-DSS body weights on day 0. Fn14-/- mice lose more body weight compared to Fn14+/+ mice (two-way ANOVA, P < 0.001; n = 7/group). (B) Percent survival of mice after 7 days of 3% DSS treatment and 14 days of recovery with drinking water. (Gehan-Breslow-Wilcoxon test, hazard ratio for Fn14-/- = 3.988, 95% CI= 1.083 - 17.82, P < 0.05). (C) Representative histopathological sections show active, severe ulcers, adjacent regenerative crypts, active cryptitis and increased inflammatory cells in the lamina propria of Fn14-/- mice (middle panel). Sections from Fn14+/+ mice treated with DSS (right panel) show regenerative colonic mucosa with focal, mild, active cryptitis and minimal inflammatory cells compared with Fn14-/- (unpaired t test; P < 0.05; n ≥ 12/group). Control mice without DSS treatment (left panel) show absence of ulcers, no infiltration of inflammatory cells in the lamina propria and no damaged epithelium. (D) High-resolution endoscopic images of the distal colon after 7 days of DSS treatment show severe inflammation in Fn14-/- mice (middle panels) and mild inflammation in Fn14+/+ mice (right panels) (unpaired t test; P < 0.001; n = 17/group). Control mice without DSS treatment (left panels) show absence of ulcers and erosions, and a visible vascular pattern without inflammation. (E) MLN lymphocytes isolated at day 8 of 3% DSS treatment and incubated for 72 hr with RPMI medium, anti-CD3 and anti-CD28 antibody (1 μg/ml). Cell free supernatants were analyzed by ELISA for production of TNF-α and IFN-γ. Fn14-/--derived cells responded by producing significantly increased levels of TNF-α (unpaired t test; P < 0.05; n ≥ 9/group) and IFN-γ (unpaired t test, 743.9 ± 31.7 vs. 507.4 ± 84.4; P < 0.05; n ≥ 8/group). Data are represented as mean ± SEM. * P < 0.05, *** P < 0.001. Results are representative of two independent experiments, performed in duplicate.

