
Figure 1. Cell populations that take up LPD in the stroma-vessel type desmoplastic tumors.
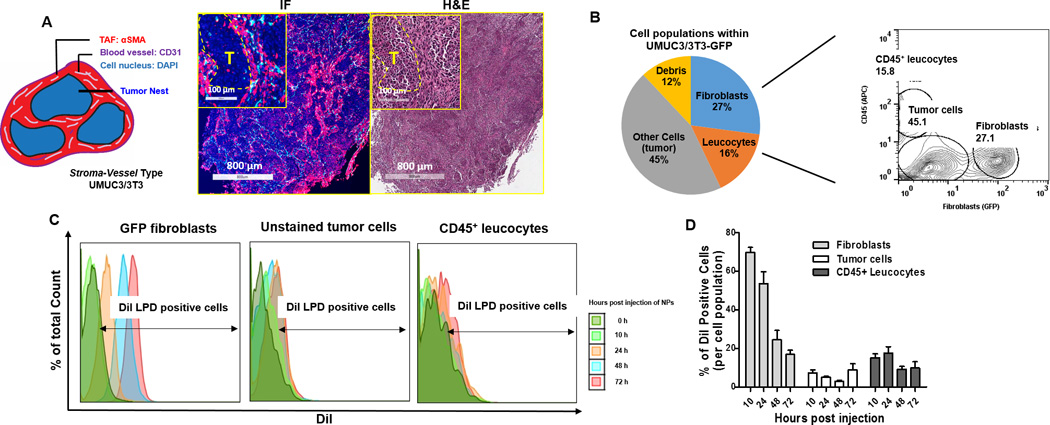
A. The schematic architecture of stroma-vessel tumors. Immunofluorescence (IF) and H&E (adjacent section of IF) images (on the right) show the histology of a stroma-vessel tumor model: UMUC3/3T3. Examination revealed nests of tumor cells (yellow dotted circles in the inserted magnified images, labeled as T), surrounded by fibrotic components (filled by αSMA positive myofibroblasts, shown in red) between them. CD31 positive blood vessels (shown in cyan) were embedded in the interstitium near myofibroblasts, almost no vessels were observed inside the nests of tumor cells. B. Flow cytometry gating of the cell populations in the UMUC3/3T3-GFP tumors. C. Flow cytometry histograms of the percentage of cells that took up DiI-labeled LPD in each cell population at determined time points. D. Quantitation of the percentage of DiI positive cells in each population (based on the flow data), n = 4.