
Figure 4. Fibroblasts (in situ) that secreted TRAIL induced the apoptosis of neighboring tumor cells.
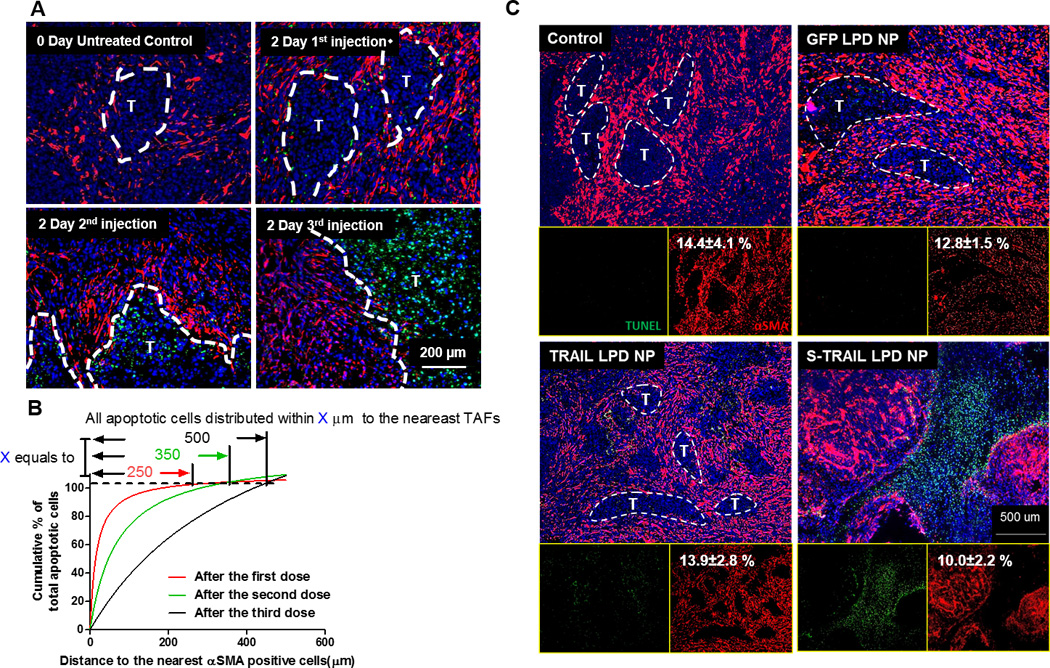
A. IF staining of αSMA and TUNEL from tumor tissues (paraffin-embedded sections) after dose escalation of sTRAIL LPD NPs. Dashed lines indicate edge of the tumor nests. B. Quantification of relative apoptotic cells’ distance from the nearest αSMA positive fibroblasts after different doses of sTRAIL LPD NPs. Numbers on top indicate the furthest distance of apoptotic cells to αSMA after different treatments. C. Paraffin-embedded tissues sections from UMUC3/3T3 tumors 2 days after final treatments were stained for αSMA (red, TAFs) and TUNEL (green, apoptosis). The % of αSMA coverage was quantified using Image J and presented as numbers in white on the left corner of each panel. Well-structured tumor nests are highlighted in the images. sTRAIL LPD NPs lead to the disruption of tumor nests and remodeling of the tumor microenvironment.