
Figure 5. sTRAIL LPD induces the reprogramming of residual fibroblasts and remodeling of TME, facilitating the delivery and antitumor effect of a second-wave nanoformulated cisplatin.
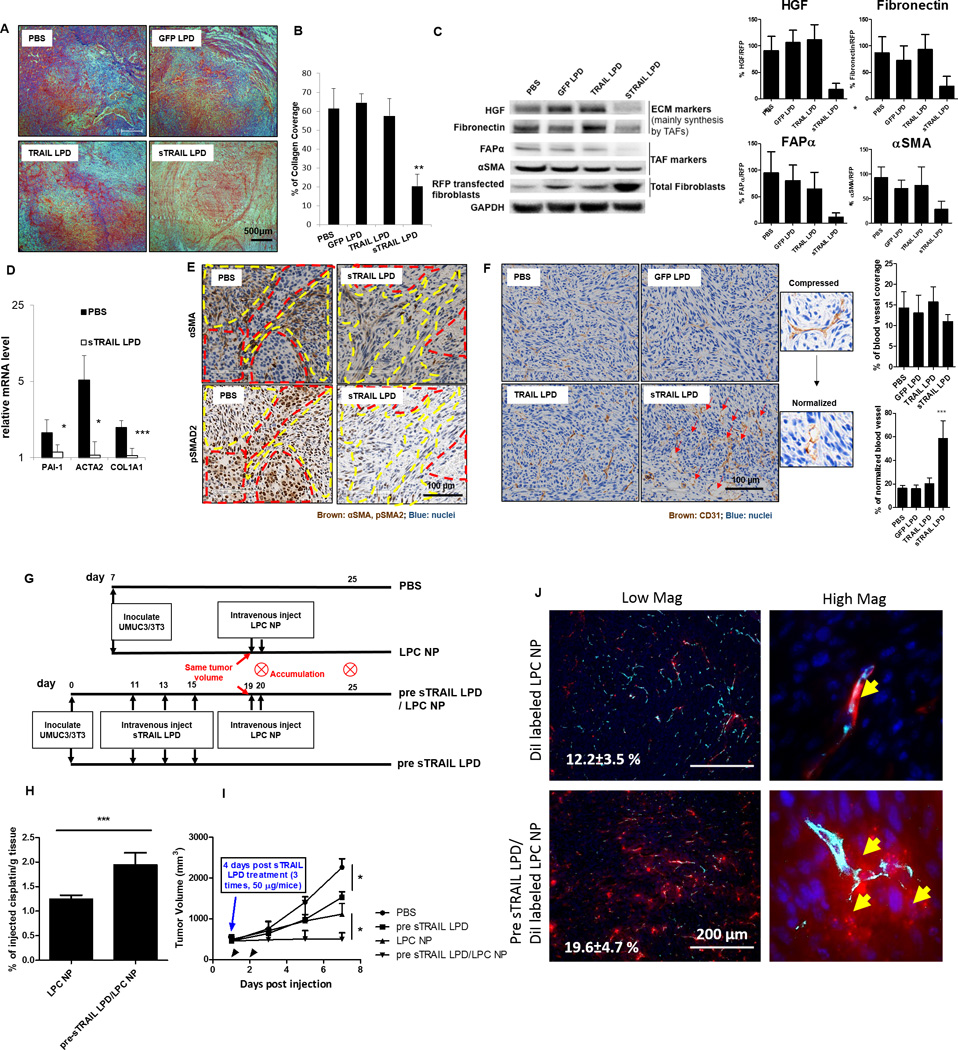
A. Masson’s trichrome staining of the collagen after endpoint treatments. B. Quantification of the trichrome staining (n = 5, ** P < 0.01, compared to PBS group). C. Western blot analysis of the TME markers mainly secreted by TAFs and TAF markers. Intensities of each ECM protein were calculated by comparing to the RFP-transfected fibroblasts and shown on right. Protein/RFP ratios in the PBS group were set as 1 (n = 3, * P < 0.05, ** P < 0.01, compared to the PBS group). D. mRNA levels of TAF markers in the sorted RFP-fibroblasts after sTRAIL treatment (n = 5, * P < 0.05, *** P < 0.01, compared to the PBS group). E. Immunohistochemistry (IHC) staining of αSMA and pSMAD2 in the adjacent sections of PBS and sTRAIL LPD groups. Red dotted circles indicate tumor nests; yellow dotted circles indicate fibroblasts. F. IHC staining of blood vessel (CD31, shown as brown) after different treatments. sTRAIL LPD induces decompression of blood vessels. Red arrows indicate the decompressed vessels. % of blood vessel coverage and % of normalized blood vessels were quantified using image J and showed on right (n = 4, *** P < 0.001) (G). Dosing schedule of the second-wave chemotherapy. (H) ICP-MS analysis of cisplatin accumulation after a single dose of cisplatin NP (LPC NP) in mice pre-treated with sTRAIL LPD or without pre-treatment (n = 5, *** P < 0.001). (I) Tumor inhibition curve of LPC NP (cisplatin, 1.9 mg/kg) after treating the tumors with sTRAIL LPD (n = 5, * P < 0.05). (J) Fluorescence images of the intratumoral distribution of DiI-labeled LPC NP after pretreating tumors with sTRAIL LPD. Blood vessels were stained with CD31 (Cyan). Numbers in white indicate the average % of DiI positive cells in the selected views. Yellow arrows in magnified images demonstrate the extravasation of DiI-NP from the blood vessels.