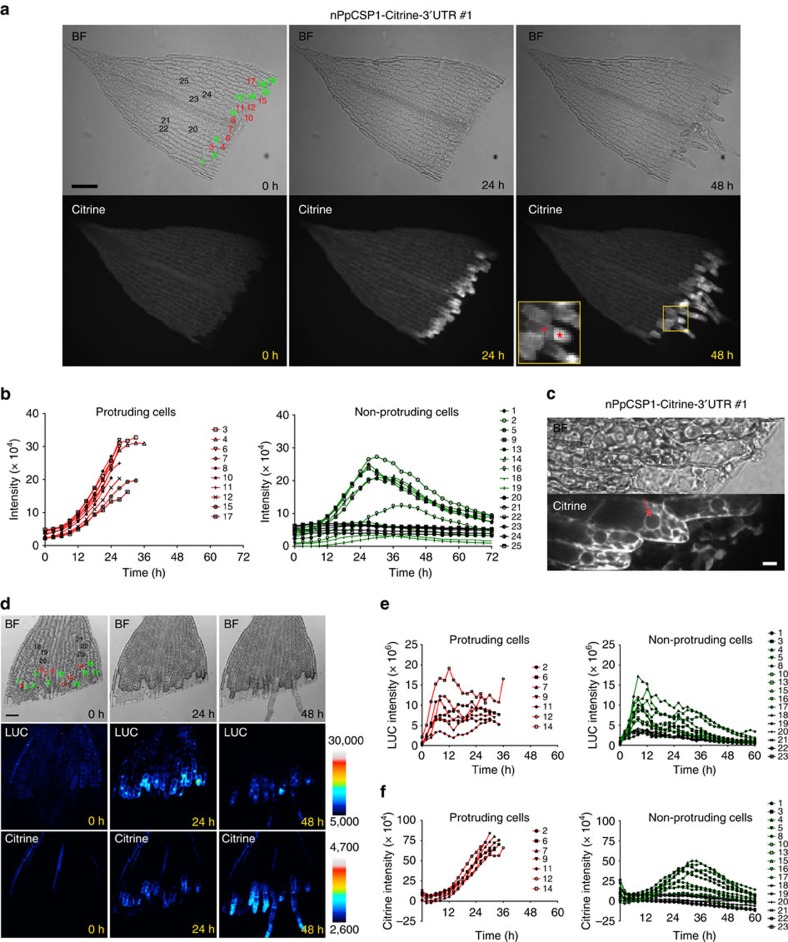
Figure 2. PpCSP1 is induced in the process of reprogramming.
(a) Expression pattern of PpCSP1-Citrine in an excised leaf of nPpCSP1-Citrine-3′-UTR #1 line. Bright-field (BF) and fluorescent (Citrine) images at 0, 24 and 48 h after cutting are shown. Inset red star and triangle indicate a distal chloronema apical stem cell and a proximal chloronema cell, respectively. All edge cells and several non-edge cells were numbered for quantitative analysis in b. See also Supplementary Movie 1. (b) The intensity of the Citrine signals in each cell of an excised leaf of nPpCSP1-Citrine-3′-UTR #1 (1–25 correspond to cells in the top panel of a). Red and green lines indicate the signal intensity in edge cells that were and were not reprogrammed into stem cells, respectively. Black lines indicate the signal intensity in non-edge cells that were not reprogrammed into stem cells. (c) PpCSP1-Citrine fusion protein localization in excised leaf cells 24 h after cutting of the nPpCSP1-Citrine-3′-UTR #1 line. Red arrow indicates the nucleus. (d) PpCSP1 promoter activity and the protein accumulation during the reprogramming. Bright-field (top), luciferase (middle) and Citrine images (bottom) of an excised leaf of the PpCSP1pro:LUC nPpCSP1-Citrine-3′-UTR #2 line at 0, 24 and 48 h after cutting. Calibration bars were shown for pseudo-colour images of LUC and Citrine, respectively. All edge cells and several non-edge cells are numbered for e,f. See also Supplementary Movie 4. (e,f) The intensity of luciferase (e) and Citrine (f) signals in each cell (indicated by 1–23 in the top left of d) in an excised leaf. Red and green lines indicate the signal intensity in edge cells that were and were not reprogrammed into stem cells, respectively. Black lines indicate the signal intensity in non-edge cells that were not reprogrammed into stem cells. Scale bars, 100 μm (a); 10 μm (c); and 50 μm (d).

