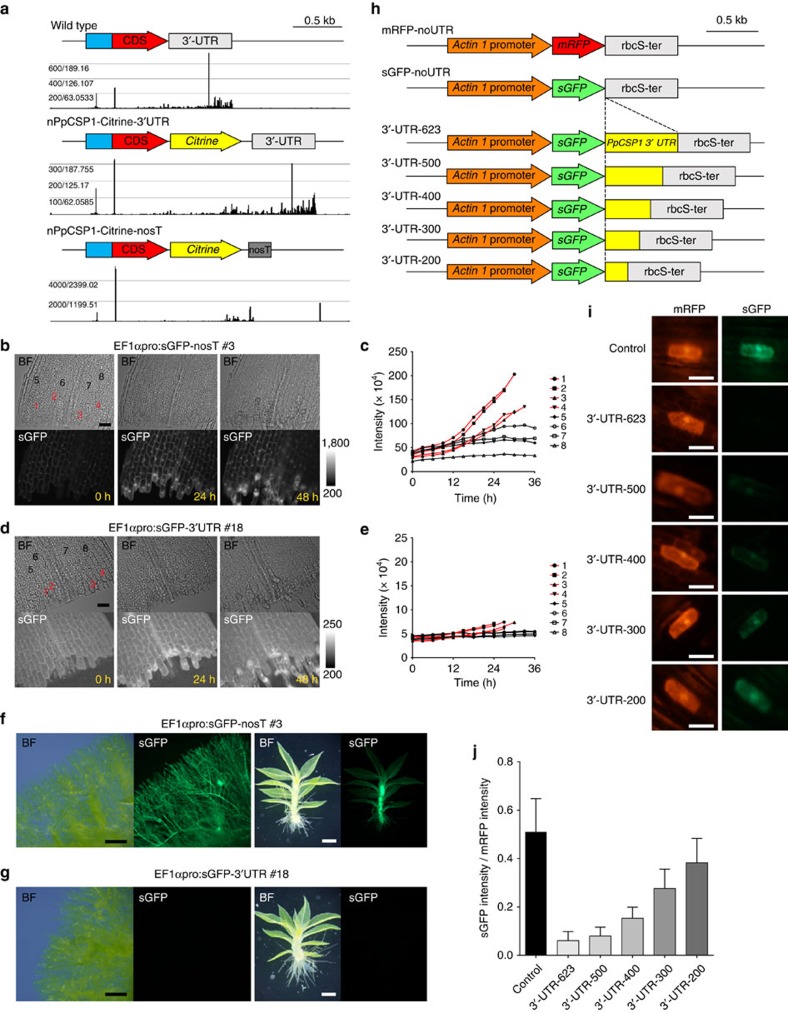
Figure 3. 3′-UTR of PpCSP1 gene has a universal degradation function.
(a) Location of 5′-end of PpCSP1 and PpCSP1-Citrine transcripts in wild-type, nPpCSP1-Citrine-3′-UTR and nPpCSP1-Citrine-nosT lines, respectively, detected by 5′-DGE transcriptome analysis. Sequence reads of full-length mRNAs were mapped around the transcription start site of the gene, and those of degraded mRNAs were mapped to other region of the transcript. (b,d) Bright-field (BF) and sGFP images of an excised leaf of EF1αpro:sGFP-nosT #3 (b) and EF1αpro:sGFP-3′-UTR #18 (d) at 0, 24 and 48 h after cutting. Several edge and non-edge cells are numbered for c,e, respectively. (c,e) The intensity of the sGFP signals in each cell of an excised leaf of EF1αpro:sGFP-nosT #3 (c) and EF1αpro:sGFP-3′-UTR #18 (e) (numbers correspond to cells in the top panels of b,d, respectively). Red and black lines indicate the sGFP intensity in cells that were and were not reprogrammed into stem cells, respectively. (f,g) Bright-field (BF) and fluorescent images of EF1αpro:sGFP-nosT #3 (f) and EF1αpro:sGFP-3′-UTR #18 (g) in protonemata and a gametophore, respectively. (h) Schematic representation of the introduced fragments. Series of the PpCSP1 3′-UTR with different lengths (yellow boxes) were connected to sGFP (green arrows), which is constitutively expressed by the rice Actin 1 promoter (orange arrows). These deletion constructs were introduced into Physcomitrella leaf cells with mRFP (red arrow) fragments (shown at the top) by particle bombardment. (i) Representative cells with mRFP (red) and sGFP (green) signals with constructs shown in h. (j) Ratio of sGFP intensity to co-transformed mRFP intensity in each transformed cell (n=10). Error bars represent s.d. Scale bars, 50 μm (b,d,i); 500 μm (f,g).

