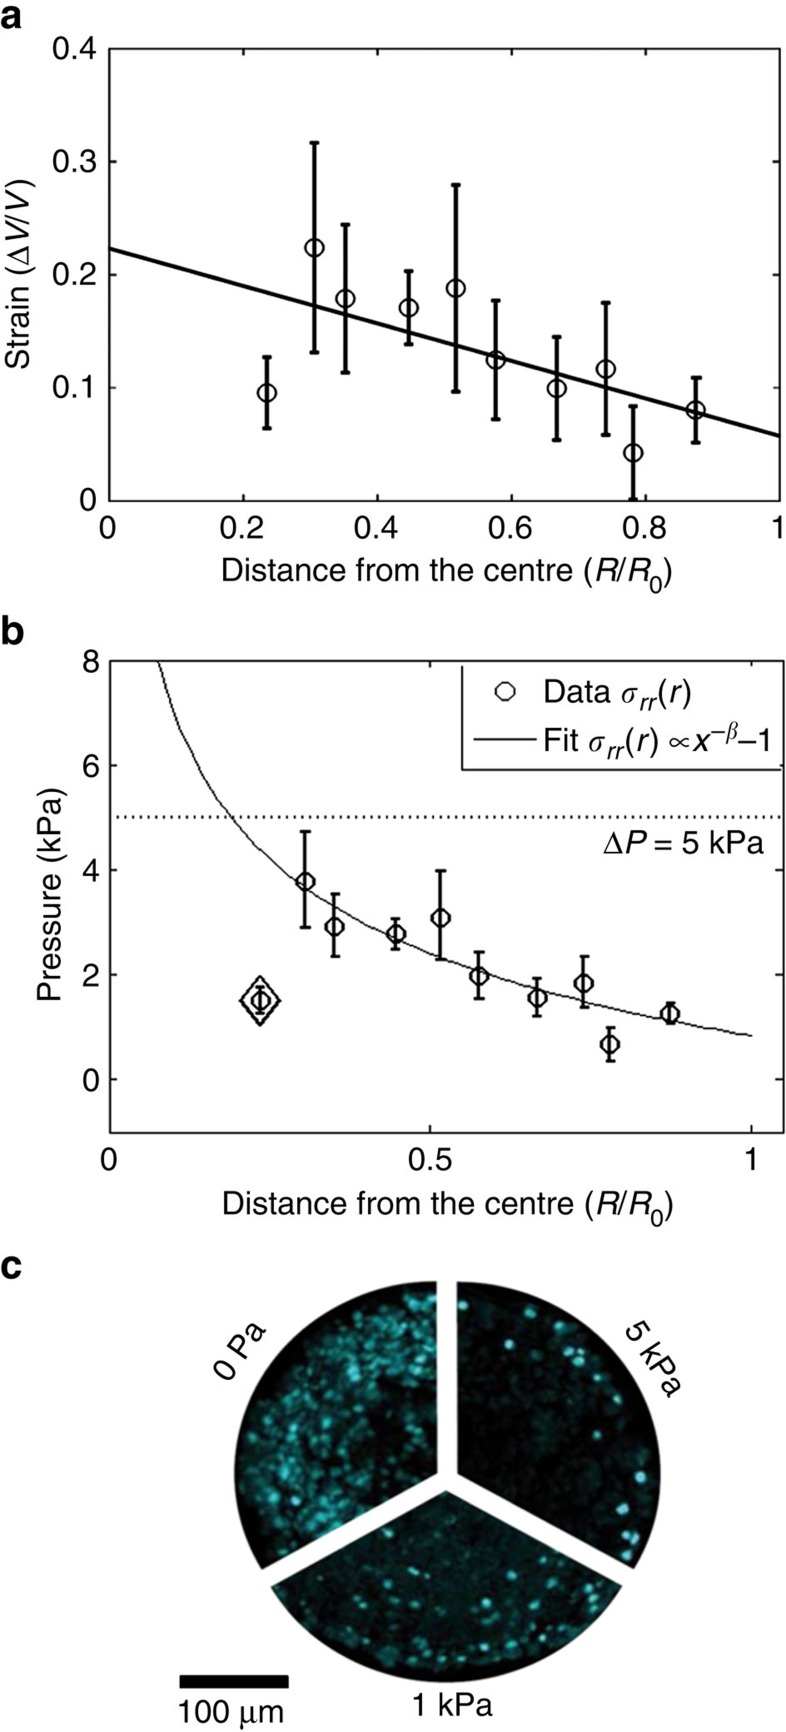
Figure 4. Pressure distribution in CT26 spheroids upon 5 kPa compressive stress.
(a) Strain profile of microbeads |V(P)-V0|/V0) along the radius of the spheroid. Data points are grouped together in bins, with the error bar being a s.e.m. and the position being an average position within the bin. The solid line is a linear fit to all experimental data points and it indicates an increasing strain towards the core of the spheroids. (b) Pressure profile obtained with a stress/strain calibration curve of PAA microbeads. The solid line represents a fit of rβ with β=−0.21±0.1. Error bars are s.e.m. The point for r∼0.22 (losange) has been omitted in this fit. (c) Cellular proliferation along the radius in a control (0 Pa) and spheroids grown under 1 and 5 kPa pressure. Images represent immunostainning for Ki-67. Reprinted with permission from Montel et al.33

