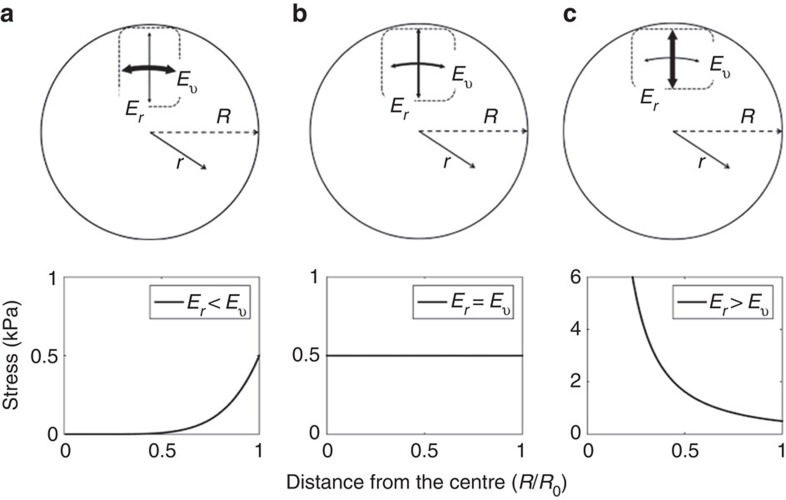
Figure 6. Stress distribution in dependence of the cellular anisotropy—theoretical model.
Graphical representation of the anisotropy within spheroids with (a) cells are softer in the radial direction (Er) than tangentially (Eν), (b) cells are mechanically isotropic and (c) cells are stiffer in the radial direction. Below: radial stress profile along the radius computed with the theoretical model of Delarue et al. For (a) stress decreases towards the core, for (b) stress is constant, and for (c) stress increases towards the core.

