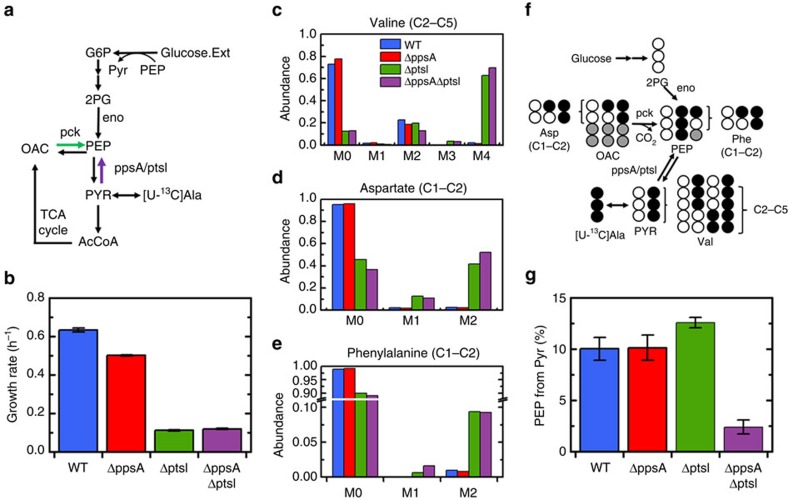
Figure 2. During growth on glucose there is a significant back-flux from PYR to PEP not carried out by PEP synthetase (ppsA).
(a) Schematic of glucose consumption and metabolism related to PEP and PYR interconversion. Glucose is transported and phosphorylated by the PTS, simultaneously converting PEP to PYR via Enzyme I (ptsI). (b) Growth rates of four strains during growth on glucose; ΔptsI and ΔppsAΔptsI were pre-grown on galactose to facilitate growth on glucose. (c) Labelling of last four carbons (C2–C5) of valine, representing the condensation of the last two carbons (C2–C3) of two PYR molecules. Labelling is mainly M0 (condensation of two unlabelled PYRs), M2 (condensation of one fully labelled PYR and one unlabelled PYR) and M4 (condensation of two labelled PYRs). (d) Labelling of the first two (C1–C2) carbons of aspartate, reflecting the labelling of the same carbons in OAC. M1 labelling is generated through scrambling in the TCA cycle. (e) Labelling of the first two (C1–C2) carbons of phenylalanine, reflecting the labelling of the first two carbons of PEP. (f) Schematic depicting the conversion of [U-13C]alanine to PEP and the measured amino acids. The relative contributions of the three sources of PEP were quantified via regression. Opened and filled circles represent unlabelled (12C) and labelled (13C) carbons, respectively. (g) Percentage of PEP generated from PYR. Approximately 10% is generated from PYR in both WT and ΔppsA strains. The contribution is slightly elevated in ΔptsI, likely due to activity of ppsA. There is minimal back-flux in ΔppsAΔptsI. Data presented in b are mean±s.e.m. of two biological replicates. Labelling data in c–e have been corrected for natural abundances and unlabelled biomass present before tracer introduction. The error presented in g reflects the propagation of GC-MS measurement error through the calculation.

