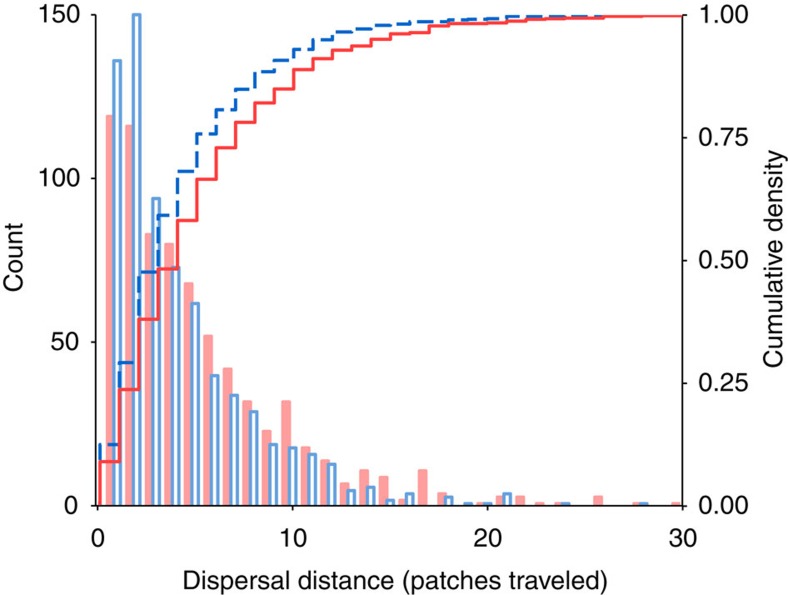
Figure 3. Comparison of post-invasion dispersal kernels.
Histograms (left axis) show dispersal distances of beetles descended from spatially sorted (filled red bars) and shuffled (open blue bars) invasions following one generation in a common environment; results from a second generation in a common environment were qualitatively similar (Supplementary Figs 4 and 5). Lines show corresponding empirical cumulative distribution functions (right axis; sorted: red solid line; shuffled: blue dashed line). Beetles from spatially sorted invasions dispersed farther on average than beetles from shuffled invasions (N=3,240, D+=0.0646, P<<0.0001). A hierarchical Bayesian analysis that accounted for random variance across replicates and fitted male and female kernels separately yielded similar results (Methods, Supplementary Tables 4 and 5).

