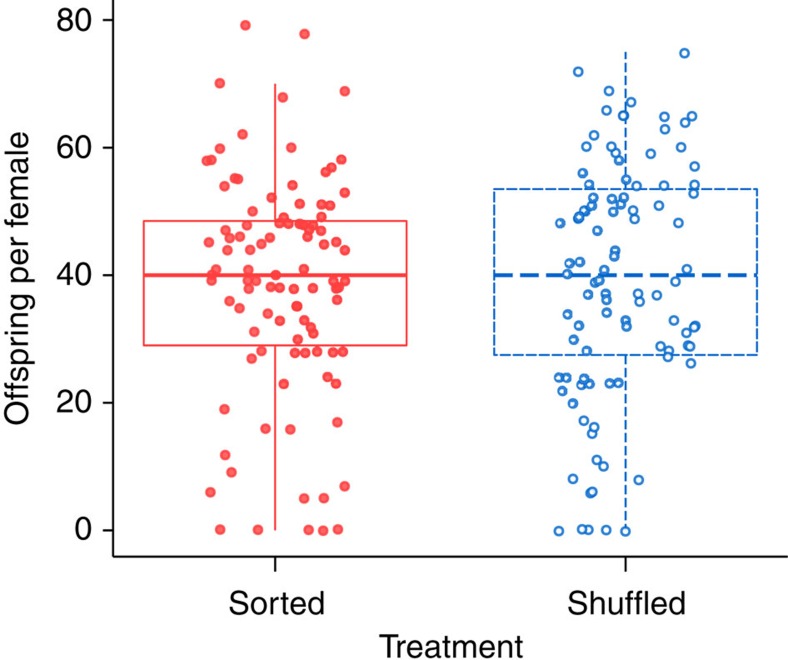
Figure 4. Comparison of post-invasion reproductive rates.
Tukey boxplots showing the number of offspring per female in spatially sorted (red solid boxes, closed circles) and shuffled (blue dashed boxes, open circles) replicates, following one generation in a common environment (nine replicate populations per treatment, 11 females per replicate, N=198). Results from a second generation in a common environment were similar (Supplementary Fig. 7). Model selection using generalized linear mixed models (GLMMs) suggests no difference between treatments (model selection results in Supplementary Table 7). Points show raw data, and are jittered along the x axis to reduce overlap.

