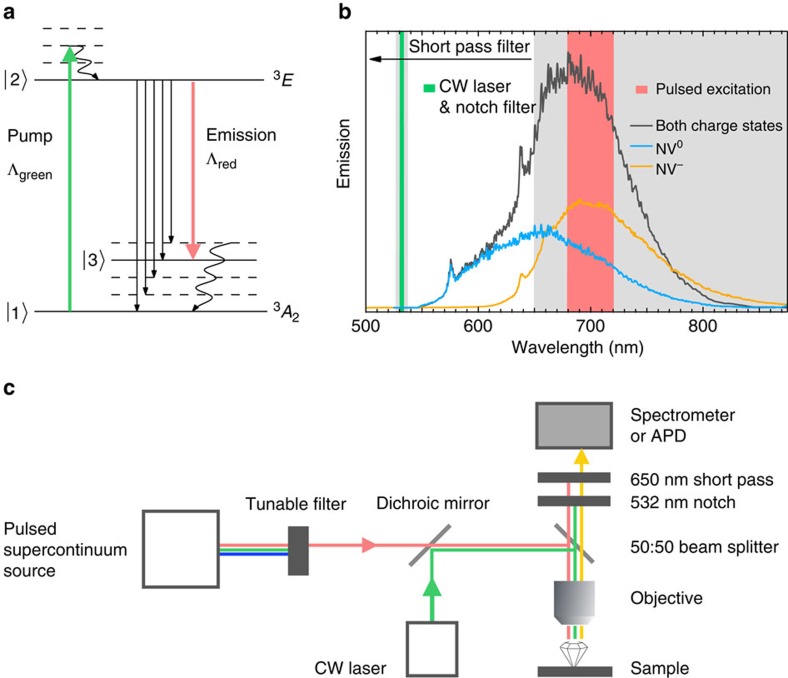
Figure 1. Stimulated emission and experimental setup.
(a) Nitrogen-vacancy centre (NV−) level structure including phonon-added states (dashed and |3〉) with pumping and emission rates. Laser pumping (green) lifts population to the excited state, which can then decay via spontaneous emission (straight black arrows) or stimulated emission (red) due to interaction with a light field whose wavelength matches the |2〉↔|3〉 transition. (b) Laser excitation (red and green columns) with short pass and notch (grey). This setup blocks laser light from the detector but still allows to monitor both NV− and NV0 emission. Example spectra are included: NV− emission (orange), NV0 emission (blue) and mixed emission (grey). (c) Experimental setup.

