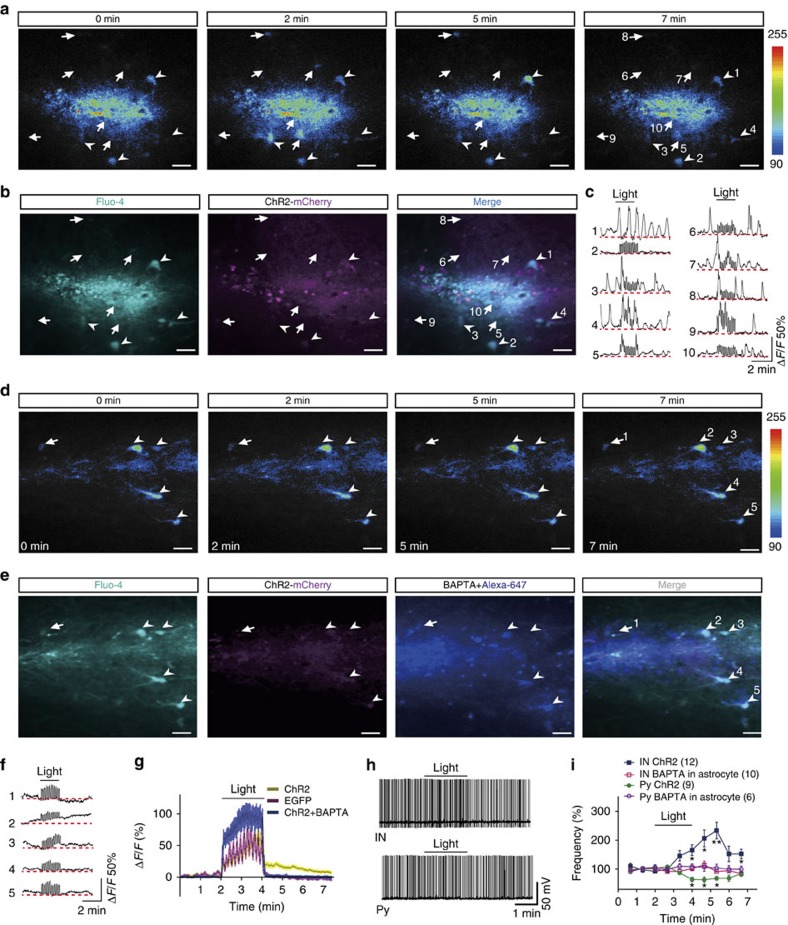
Figure 2. Light stimuli induced prolonged calcium increase in astrocytes that can be blocked by astrocytic loading of BAPTA.
(a) Example time-lapse images of Ca2+ signals. Light stimuli were applied at time point 2 min and lasted for 2 min. (b) Confocal images showing the ChR2-expressing astrocytes loaded with the Ca2+ fluorescent dye Fluo-4. Images were sampled from the same field as in a. Scale bars in a and b indicate 20 μm. (c) Example traces of light-induced Ca2+ signals (ΔF/F) in astrocyte as numbered in a and b. Note that light stimulation initially induced Ca2+ elevation in ChR2-expressing astrocytes (traces 1, 3, 4), which then propagated to non-ChR2-expressing cells (traces 5, 7, 8, 9). The noise appearing during light stimulation reflect sampled artificial signals caused by blue light stimulation. Dotted red lines indicate base level of Ca2+ signals. (d) Example time-lapse images of Ca2+ signals in astrocytes loaded with BAPTA. (e) Confocal images showing the ChR2-expressing astrocytes bulk loaded with the Ca2+ fluorescent dye Fluo-4 and intracellularly loaded BAPTA together with Alexa 647. Images were sampled from the same field as in d. (f) Example traces of light-induced Ca2+ signals (ΔF/F) in astrocyte as numbered in d and e. Dotted red lines indicate base level of Ca2+ signals. (g) Summary data showing the changes in calcium signals (ΔF/F) in slices expressing ChR2, EGFP or ChR2 loaded with BAPTA. Data are averaged from more than six slices in three independent experiments for each condition. Note elevated calcium level after light stimulation in ChR2 group (yellow trace). (h) Sample traces showing AP firing of interneuron (upper) and pyramidal neuron (lower) before, during and after 2 min of light stimulation (1 Hz, 0.5 s on and 0.5 s off) of astrocytes expressing ChR2 and loaded with BAPTA. (i) Summary data showing the time courses of AP frequency of interneurons (IN) and pyramidal neurons (Py) before, during and after light stimulation (bar) of slices expressing ChR2 with and without BAPTA loading in astrocytes (two-way analysis of variance, for interneuron F(9,207)=4.89, P<0.0001; for pyramidal neuron F(9,110)=2.26, P=0.023).

