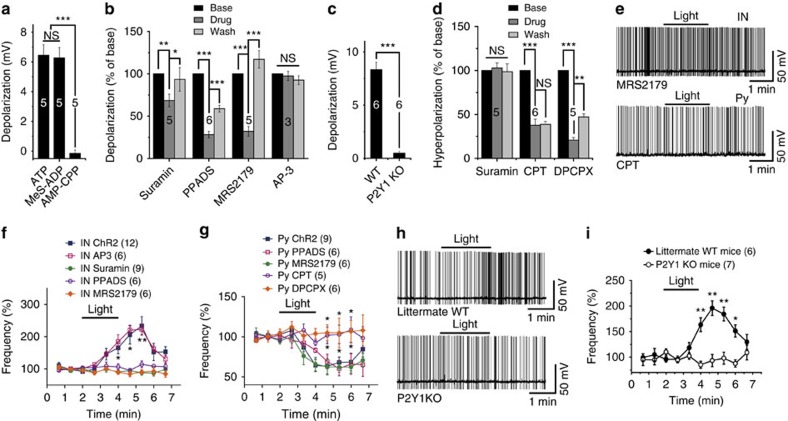
Figure 4. Receptors involved in the modulation of neuronal excitability by ATP.
(a) Summary of membrane potential changes after puffing with 100 μM ATP, 100 μM Mes-ADP or 100 μM AMP-CPP. Note that the three agonists were applied to the same interneurons. Student's t-test, not significant (NS) P=0.434, ***P<0.0001. (b) Summary of normalized data showing the percentage inhibition of ATP-induced depolarization by P2 receptor and mGluR antagonists (Student's t-test, suramin: **P=0.007, *P=0.035, PPADS: ***P<0.0001, ***P<0.0001, MRS2179: ***P=0.0003, ***P=0.0001, AP-3: P=0.253). (c) Summary of ATP-induced membrane potential change in interneurons in wild-type (WT) and P2Y1 knockout (KO) mice. The six most depolarized cells (6 of 13) were chosen for statistical analysis (Student's t-test, ***P<0.0001). (d) Summary of normalized data showing the percentage inhibition of ATP-induced hyperpolarization by various antagonists (Student's t-test, suramin: P=0.46, CPT: ***P<0.0001, NS P=0.373, DPCPX: ***P<0.0001, **P=0.0057). (e) Sample trace of interneuron and pyramidal neuron AP firing before, during, and after 2 min of light stimulation of astrocytes expressing ChR2 in the presence of 20 μM MRS2179 (upper panel) or 1 μM CPT (lower panel). (f) Summary data showing the time course of AP firing frequency of interneurons before, during and after light stimulation (bar) in the presence of AP-3 (two-way analysis of variance (ANOVA), F(9,167)=0.2, P=0.9938), suramin (two-way ANOVA, F(9,197)=4.56, P<0.0001), PPADS (two-way ANOVA, F(9,167)=2.5, P=0.011,), or MRS2179 (two-way ANOVA, F(9,167)=3.16, P=0.0015). (g) Summary data showing the time course of pyramidal neuron AP firing frequency before, during and after light stimulation (bar) in the presence of PPADS (two-way ANOVA, F(9,120)=0.94, P=0.491), MRS2179 (two-way ANOVA, F(9,120)=0.41, P=0.927), CPT (two-way ANOVA, F(9,110)=2.2, P=0.0272) or DPCPX (two-way ANOVA, F(9,120)=2.11, P=0.0336). (h) Sample traces of interneuron AP firing before, during and after 2 min of light stimulation of astrocytes expressing ChR2 in littermate WT (upper) and P2Y1 KO mice (lower). (i) Summary data showing the time course of AP firing frequency of interneurons before, during and after light stimulation (bar) in littermate WT and P2Y1 KO mice (two-way ANOVA, F(9,110)=7.42, P<0.0001).

