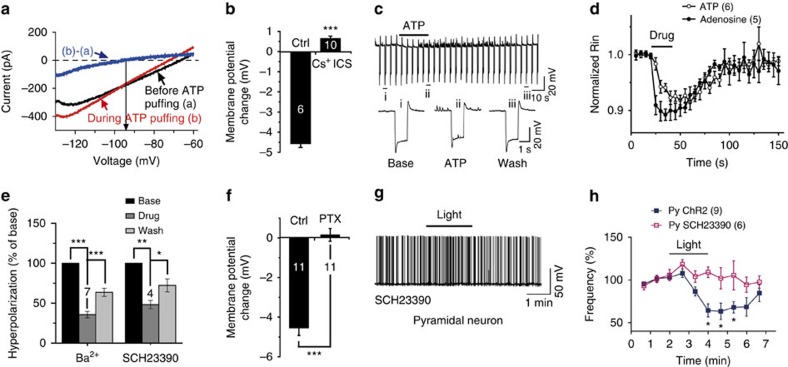
Figure 6. ATP inhibits pyramidal neurons by opening GIRK channels.
(a) Current–voltage (I–V) curve of ATP-induced inward current determined by subtracting the voltage ramps (from −130 to −60 mV, 10 mV s−1) recorded during ATP puffing from the same ramps recorded at rest. (b) Summary of ATP-induced membrane potential changes recorded from pyramidal neurons using K+- or Cs+-based ICS (Student's t-test, ***P<0.0001). (c) Sample trace showing pyramidal neuron Rin recorded before, during and after ATP (100 μM) puffing monitored by −50 pA current injection every 5 s. (i), (ii) and (iii) indicate representative Rin traces in each period as indicated. (d) Time course of interneuron Rin changes during ATP or adenosine application (two-way analysis of variance (ANOVA), F(1,300)=5.19, P=0.0235). Data are normalized to the Rin averaged from 20 s of recording before drug application in each case. (e) Summary data showing the percentage inhibition of ATP-induced hyperpolarization by the GIRK channel blocker Ba2+ (10 μM, Student's t-test, ***P<0.0001, ***P=0.00036) or SCH23390 (10 μM, Student's t-test, **P=0.0013, *P=0.027). (f) Summary of ATP-induced pyramidal neuron membrane potential change in cultured slices with or without PTX (Student's t-test, ***P<0.0001). (g,h) Sample trace and summary data showing the time course of AP firing frequency before, during and after light stimulation (bar) in the presence of SCH23390 in pyramidal neurons (Py) (two-way ANOVA, F(9,120)=2.21, P=0.026). Data are normalized to the AP frequency averaged from 2 min of recording before light stimulation in each case.

