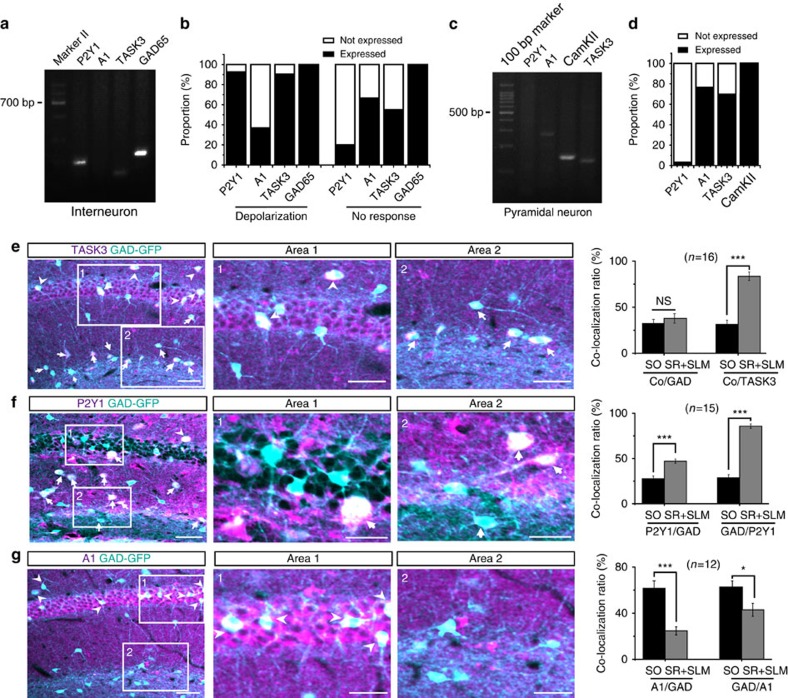
Figure 7. TASK3 channel and P2Y1/A1 receptors expression patterns differ between interneurons and pyramidal neurons.
(a) Representative agarose gel electrophoresis image of single-cell RT–PCR showing the expression of P2Y1, A1, TASK3 and GAD65 in an ATP-depolarized interneuron. (b) Summary data showing the percentage of P2Y1, A1, TASK3 and GAD65 expression in interneurons. (c) Representative agarose gel electrophoresis image of single-cell RT–PCR showing the expression of P2Y1, A1, TASK3 and CAMK II in a pyramidal neuron. (d) Summary data showing the percentage of P2Y1, A1, TASK3 and CAMK II expression in pyramidal neurons. (e) Left: immunostaining for the expression of TASK3 in GAD-GFP mouse hippocampus. Scale bars, 60 μm. Insets: enlargement of areas 1 and 2 at left. Scale bars, 30 μm. Right: summary data showing the percentage of co-localization between TASK3 and GAD-GFP in SR/SLM and stratum oriens (SO) (Student's t-test, P=0.446, ***P<0.0001). (f) Left: immunostaining for the expression of P2Y1 receptors in GAD-GFP mouse hippocampus. Scale bars, 60 μm. Insets: enlargement of areas 1 and 2 at left. Scale bars, 30 μm. Right: summary data showing the percentage of co-localization between P2Y1 and GAD-GFP in SR/SLM and SO (Student's t-test, ***P<0.0001, ***P<0.0001). (g) Left: immunostaining for the expression of A1 receptors in GAD-GFP mouse hippocampus. Scale bars, 80 μm. Insets: enlargement of areas 1 and 2 at left. Scale bars, 40 μm. Right: summary data showing the percentage co-localization of A1 and GAD-GFP in SR/SLM and SO (Student's t-test, ***P<0.0001, *P=0.0144,). Note that numbers indicate slices being analysed not cell numbers. Co-localization is indicated by arrows in the SR/SLM and by arrowheads in the SO/stratum pyramidale (SP). NS, not significant.

