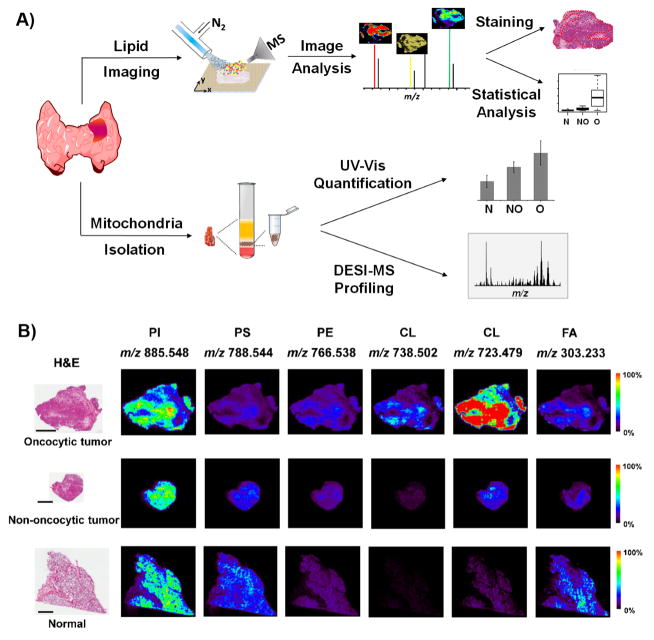
Figure 2. Experimental design for tissue analysis and imaging using DESI-MSI.
A) Workflow for imaging and mitochondria isolation experiments in thyroid tissues. B) DESI-MSI analysis of an oncocytic tumor, non-oncocytic tumor and normal thyroid tissues. The optical images on the left are from the same tissue sections which were H&E stained after analyzed by non-destructive DESI-MS imaging. Scale bar=4 mm. Six representative ion images from different lipid ions, including PI (20:4/18:0) at m/z 885.548, PS (18:1/18:0) at m/z 788.544, PE (20:4/18:0) at m/z 766.538, CL (20:4/20:2/18:1/16:0 or 20:3/18:2/18:1/18:1 or 20:2/18:2/18:2/18:1) at m/z 738.502, CL (18:2/18:2/18:2/18:2 or 20:4/18:2/18:2/16:0) at m/z 723.479, and FA (20:4) at m/z 303.233 are presented.

