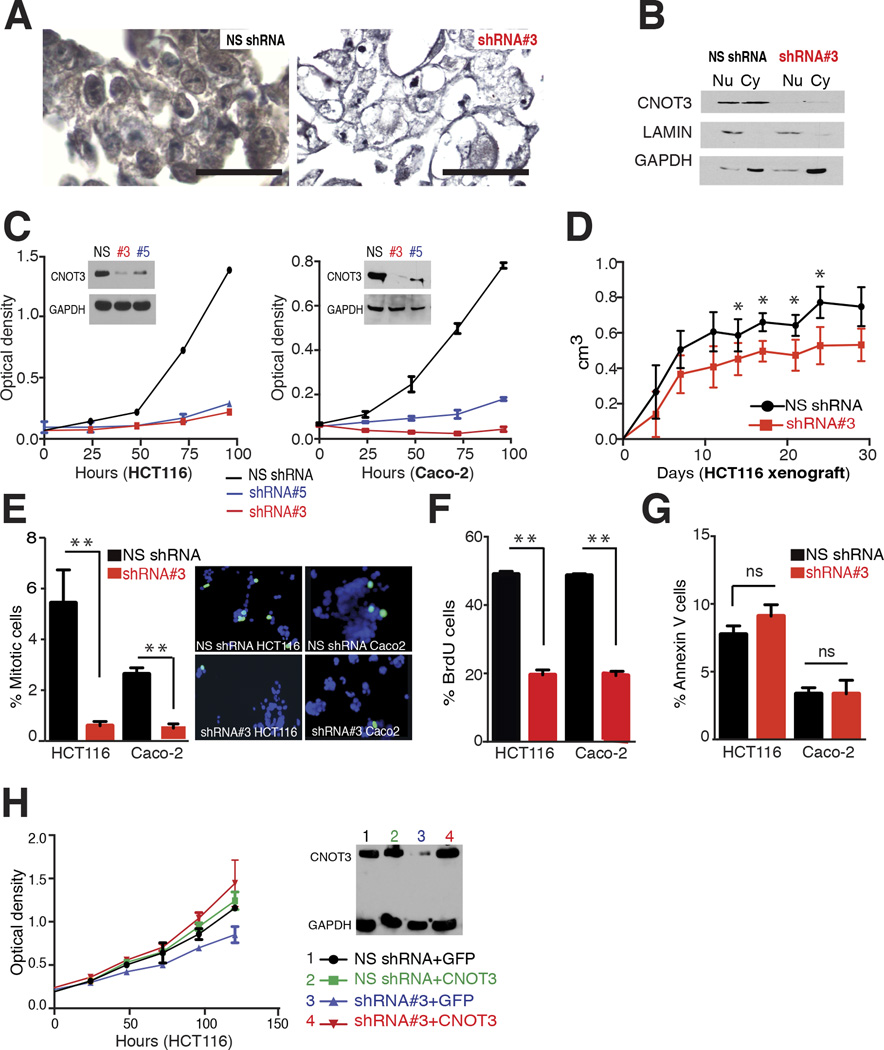
Figure 3. Effects of CNOT3 depletion on CRC cells.
(A) CNOT3 immunocytochemistry in HCT116 cells treated with control, non-specific (NS) shRNA (left) or with CNOT3-specific shRNA #3 (right), confirming CNOT3 loss and Ab specificity and showing typical changes in morphology of CNOT3-depleted cells. (B) Immunoblot analysis of nuclear (Nu) and cytoplasmic (Cy) fractions of HCT116 cells treated with non-specific (NS) or CNOT3-specific shRNA #3. LaminB1 and GAPDH serve to mark the Nu and Cy fractions, respectively. (C) Reduced CNOT3 levels, achieved with two independent shRNAs (#3 and #5, immunoblot in the inset), impaired proliferation of CRC cell lines HCT116 (left) and Caco-2 (right), compared to treatment with a non-specific (NS) control shRNA. Each value represents the mean ± SD optical density from triplicate samples; other cell lines are shown in Suppl. Fig. 3C. (D) Reduced growth of CNOT3-depleted HCT116 cells in murine xenografts. Each plotted value represents the mean ± SD from 5 replicates. (E–G) Significantly reduced phospho-Histone H3 staining (E, determined manually in blind counts) and BrdU uptake (F, determined by flow cytometry) in CNOT3-depleted HCT116 and Caco-2 cells, without concomitant change in apoptotic AnnexinV+ cells (G, flow cytometry). Graphs represent the mean ± SD from 3 replicates. (F) An shRNA-resistant CNOT3 cDNA construct, but not a GFP cDNA control, restored cell replication in HCT116 cells depleted of endogenous CNOT3 using shRNA #3. The immunoblot shows relative CNOT3 and GAPDH levels in total cell lysates.

