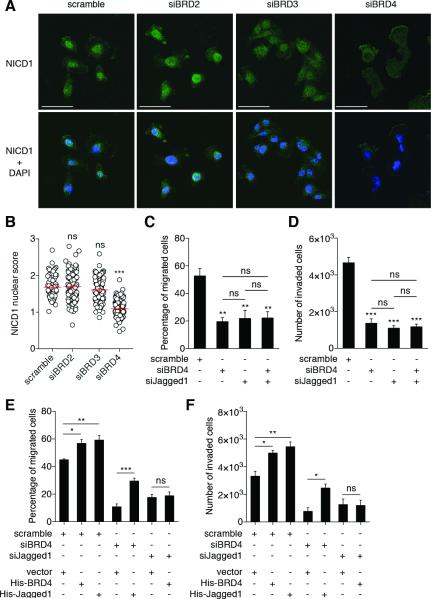
Figure 4. Jagged1/Notch1 signaling pathway acts downstream of BRD4 to regulate breast cancer cell migration and invasion.
(A) Representative images from immunofluorescence experiments showing the cellular NICD1 distribution. NICD1 is stained in green and nuclei in blue, with DAPI in merged images (lower panels). Scale bar: 50 μm.
(B) NICD1 nuclear score (for calculation details, see Experimental Procedures section). One dot represents a measurement of one cell. Bars show means ± SEM of three independent experiments. Statistical analyses were performed by using one-way ANOVA.
(C-D) MDA-MB-231 were transfected with the indicated siRNAs (scramble, siBRD4: 50 nM; siJagged1: 20 nM) for 72h prior to conduct migration (C) and invasion (D) assays. Bars show means ± SEM of three independent experiments. Statistical analyses were performed by using one-way ANOVA.
(E-F) MDA-MB-231 were transfected with the indicated siRNAs (scramble, siBRD4: 50 nM; siJagged1: 20 nM) for 72h and plasmids for 24h prior to conduct migration (E) and invasion (F) assays. Bars show means ± SEM of three independent experiments. Statistical analyses were performed by using one-way ANOVA.
The following symbols were used to indicate significant differences: ns, p > 0.05; *, p < 0.05; **, p < 0.01; ***, p < 0.001.

